SNEAK PEEK
- XRP struggles with bearish pressure, but rising trading volume sparks optimism.
- Oversold conditions hint at potential short-term recovery for XRP.
- Despite challenges, experts hold positive views on XRP’s future.
Despite facing a significant decline in the past 24 hours and encountering strong resistance at $0.7174, XRP tried to recover but was unsuccessful. As a result, the bears successfully pushed the price down to a low of $0.6835, where it eventually found support.
During this writing, the bearish market conditions persisted, causing a further 2.46% drop in XRP’s price to $0.6897 compared to the previous close. Nonetheless, XRP’s market capitalization experienced a slight decrease of 2.58%, settling at $36,326,195,999.
Interestingly, there was a notable positive movement in the 24-hour trading volume, which surged by 15.86% to $1,683,688,545. This increase in trading volume indicates that despite the recent price dip, experts still hold optimistic views about XRP’s future.
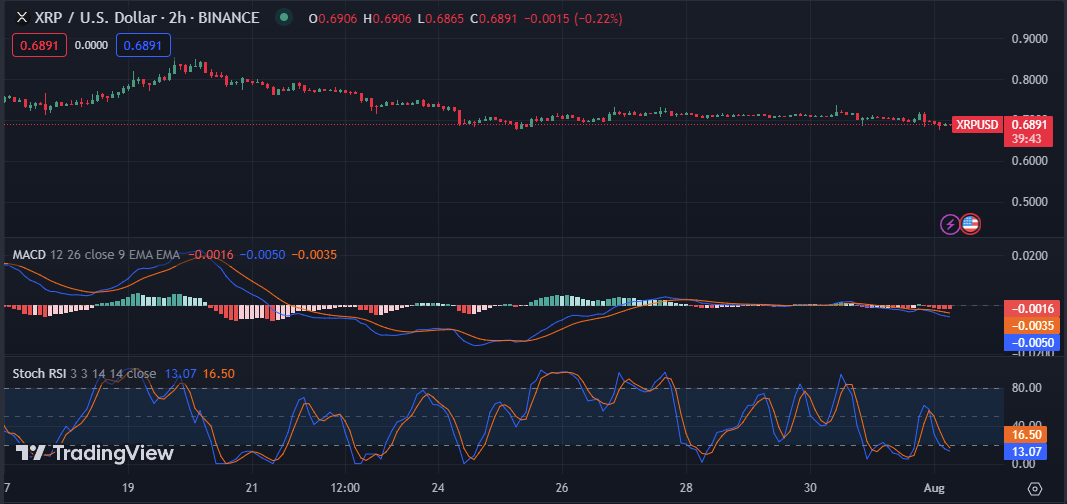
On the 2-hour price chart of the XRP market, the MACD blue line is below the signal line and in the negative region with a reading of -0.0050. This situation may prompt investors to consider selling their XRP tokens or waiting for a potential price drop before repurchasing, indicating a bearish sentiment in the market.
Additionally, the Stochastic RSI reading is at 13.07 and has moved below the signal line on the 2-hour price chart for XRP. This move implies that XRP is oversold and might experience a short-term recovery. However, traders must be cautious as this might be a temporary relief rally rather than a lasting trend reversal.

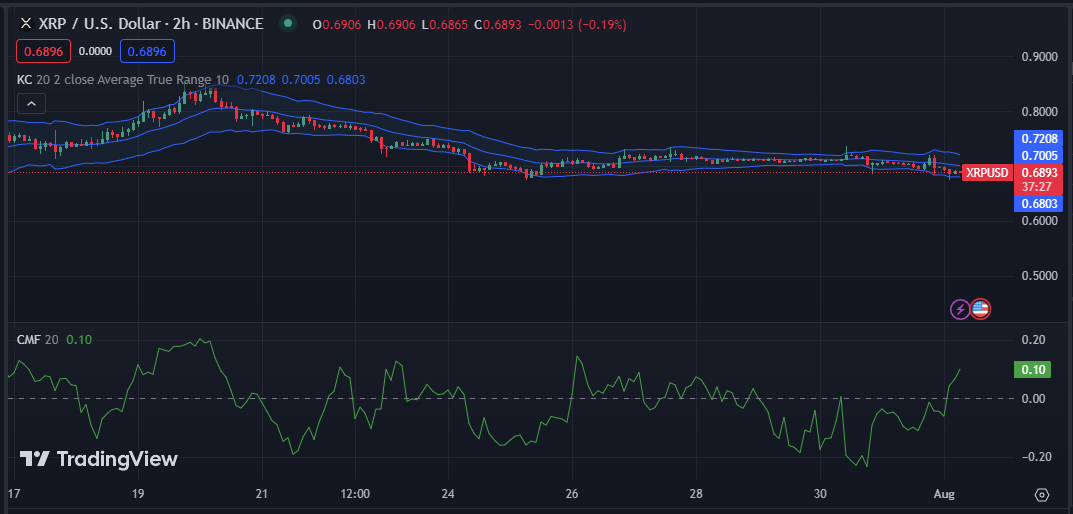
Based on the XRP price chart, the Keltner Channel bands’ top and bottom bars have readings of 0.7005 and 0.6593, respectively. This pattern suggests that the price of XRP is likely to drop further and may soon test the lower support level.
The price action movement, characterized by red candlesticks towards the bottom band, supports this view. If the price continues to move in this direction and breaks the lower band, the market is oversold, which could lead to a potential reversal or recovery.
Furthermore, the Chaikin Money Flow (CMF) value of 0.10 on XRP’s price chart suggests more selling pressure than buying demand. This move indicates that investors are selling XRP more than they are buying it, potentially leading to further price reductions if this trend continues.

In conclusion, XRP faces challenges with bear dominance, but hopeful signs in rising volume and oversold conditions indicate the potential for a rebound.
Disclaimer: Cryptocurrency price is highly speculative and volatile and should not be considered financial advice. Past and current performance is not indicative of future results. Always research and consult with a financial advisor before making investment decisions.
- SEO Powered Content & PR Distribution. Get Amplified Today.
- PlatoData.Network Vertical Generative Ai. Empower Yourself. Access Here.
- PlatoAiStream. Web3 Intelligence. Knowledge Amplified. Access Here.
- PlatoESG. Automotive / EVs, Carbon, CleanTech, Energy, Environment, Solar, Waste Management. Access Here.
- BlockOffsets. Modernizing Environmental Offset Ownership. Access Here.
- Source: https://investorbites.com/xrp-price-analysis-01-08/
- :has
- :is
- :not
- :where
- 10
- 13
- 15%
- 195
- 22
- 24
- a
- About
- Action
- advice
- advisor
- always
- Amid
- analysis
- and
- ARE
- AS
- At
- BAND
- bars
- BE
- Bear
- bearish
- Bears
- before
- below
- Blue
- Bottom
- breaks
- but
- Buying
- by
- candlesticks
- capitalization
- causing
- cautious
- challenges
- Channel
- characterized
- Chart
- Close
- compared
- conclusion
- conditions
- Consider
- considered
- continues
- could
- Current
- decisions
- Decline
- decrease
- Demand
- Despite
- Dip
- direction
- down
- Drop
- encountering
- eventually
- experience
- experienced
- experts
- faces
- facing
- financial
- financial advice
- flow
- For
- found
- further
- future
- Have
- highly
- hold
- hope
- hopeful
- HOURS
- However
- HTTPS
- if
- in
- Increase
- indicate
- indicates
- internal
- investment
- investor
- Investors
- IT
- lasting
- lead
- leading
- Level
- likely
- Line
- Low
- lower
- MACD
- Making
- Market
- Market News
- May..
- might
- money
- more
- move
- moved
- movement
- must
- negative
- news
- notable
- of
- on
- Optimism
- Optimistic
- or
- past
- Pattern
- performance
- plato
- Plato Data Intelligence
- PlatoData
- positive
- potential
- potentially
- pressure
- previous
- price
- PRICE ACTION
- Price Analysis
- price chart
- pushed
- rally
- rather
- Reading
- rebound
- recent
- Recover
- recovery
- Red
- region
- relief
- research
- Resistance
- respectively
- result
- Results
- Reversal
- Ripple
- Ripple News
- rising
- rsi
- Selling
- sentiment
- settling
- short-term
- should
- Signal
- signals
- significant
- Signs
- situation
- soon
- Source
- Sparks
- speculative
- Still
- strong
- Struggles
- Successfully
- Suggests
- support
- support level
- Supports
- Surged
- temporary
- test
- than
- that
- The
- their
- There.
- they
- this
- to
- Tokens
- top
- towards
- Traders
- Trading
- trading volume
- TradingView
- Trend
- tried
- turbulence
- value
- View
- views
- volatile
- volume
- Waiting
- was
- which
- with
- writing
- xrp
- XRP Price
- XRP price analysis
- XRP/USD
- zephyrnet


