SNEAK PEEK
- Bears dominate the XRP market, causing prices to drop.
- The Money Flow Index suggests moderate volatility and bearishness.
- RSI nears oversold levels, signalling buying opportunity.
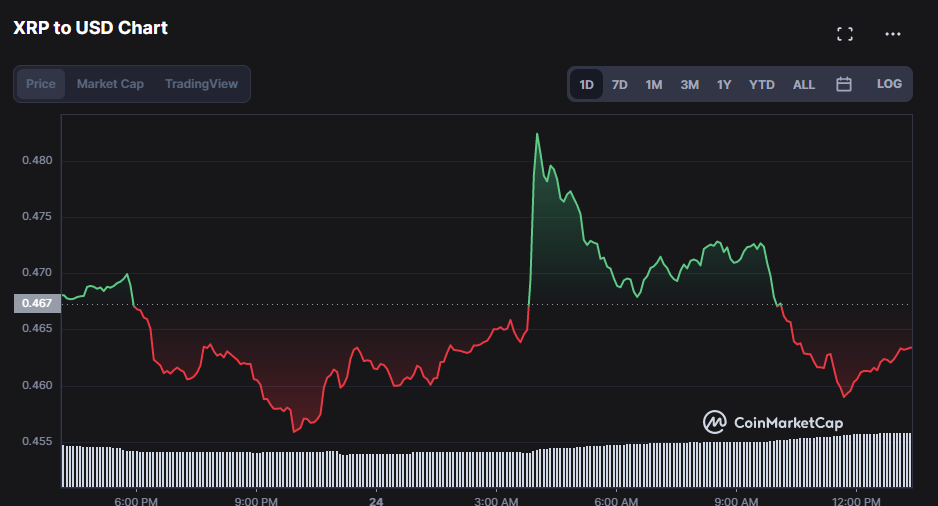
Over the past 24 hours, bears have dominated the XRP (XRP) market, causing the price to fall from an intraday high of $0.4825 to an intraday low of $0.4559. Profit-taking by investors who had bought at lower levels and the overall adverse market attitude may be to blame for this price decrease.
#XRP Will Crash:
The below chart is a proof about the Crashing Structure.
And people say #XRP Cannot Crash Hard. #XRPArmy STAY STEADY, #XRP will be Crashing Hard. pic.twitter.com/Rduc87EPPl
— EGRAG CRYPTO (@egragcrypto) April 24, 2023
As of press time, ongoing bearish pressure had caused the price to drop by 0.38% to $0.4655. This decrease indicates a severe market correction and a significant fall.
The recession caused XRP’s market capitalization to drop by 0.37% to $24,096,642,381, while the trading volume increased by 25.86% to $1,147,519,537. This pattern suggests that despite the drop, investors engage in aggressive trading, indicating a shift in investment goals from long-term growth to short-term profits.

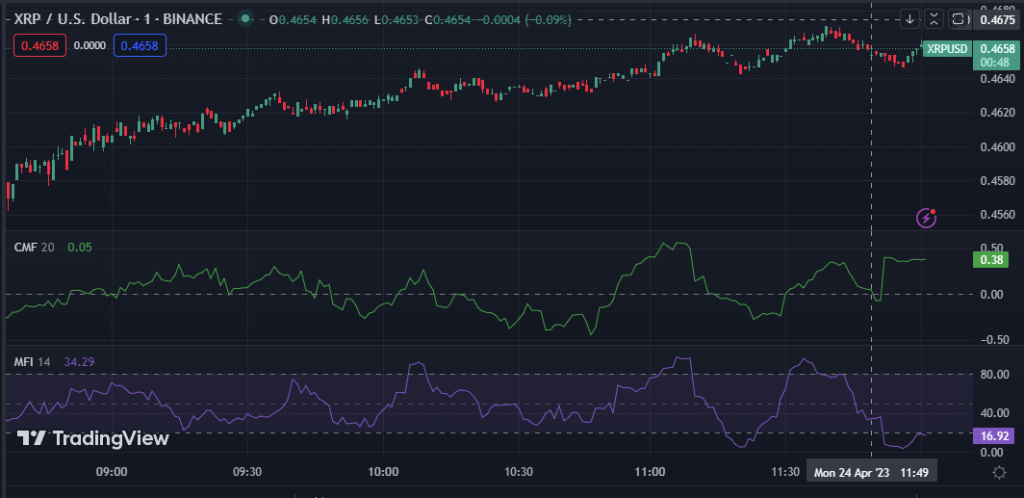
The Chaikin Money Flow (CMF) rating of 0.56 and movement in the positive area suggest that XRP’s bearishness is likely to be transitory and that an upward price movement is expected to occur soon. If the CMF continues above zero in the following hours, it can indicate a positive trend.
On the XRP market’s 4-hour price chart, the Money Flow Index (MFI) line has a value of 7.75 and points south. According to this, the market is bearish, and selling pressure can continue shortly. This movement shows moderate volatility in the XRP market, with prices most likely fluctuating within a relatively small range.

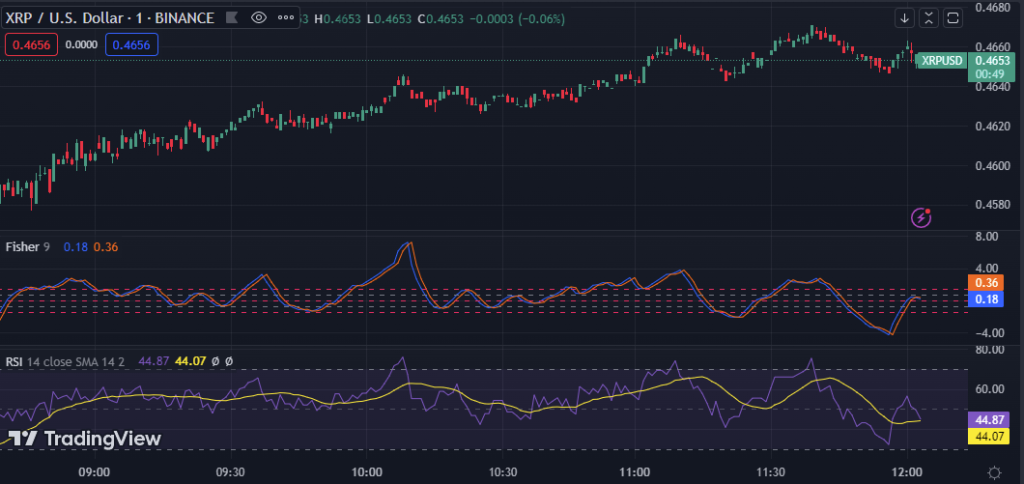
The Fisher Transform’s movement below its signal line at a value of 1.71 indicates that the bear’s hold on XRP is now vital. Traders should consider taking short positions or waiting for a reversal signal before beginning long bets. This trend suggests that the bear’s momentum will probably continue soon, but traders should watch for any possible support levels that could give a buying opportunity.
On the price chart for XRP, the Relative Strength Index (RSI) is at 56.64, and the signal line is at 59.87. Since the RSI is not oversold and can drop further before reaching a decent buying opportunity, this RSI movement shows that the current bearishness in the XRP price may persist. For traders looking to enter the market, the RSI’sRSI’s proximity to oversold levels may signal a potential trend reversal and a buying opportunity.

Despite the recent dip in XRP prices, increased trading volume and bullish indicators suggest a potential upswing.
Disclaimer: Cryptocurrency price is highly speculative and volatile and should not be considered financial advice. Past and current performance is not indicative of future results. Always research and consult with a financial advisor before making investment decisions.
- SEO Powered Content & PR Distribution. Get Amplified Today.
- Platoblockchain. Web3 Metaverse Intelligence. Knowledge Amplified. Access Here.
- Minting the Future w Adryenn Ashley. Access Here.
- Source: https://investorbites.com/xrp-price-analysis-24-04/
- :has
- :is
- :not
- 1
- 22
- 7
- 8
- a
- About
- above
- According
- adverse
- advice
- advisor
- aggressive
- always
- an
- analysis
- and
- any
- AREA
- At
- attitude
- BE
- bearish
- Bears
- before
- Beginning
- below
- Bets
- bought
- Bullish
- but
- Buying
- by
- CAN
- cannot
- capitalization
- caused
- causing
- Center
- Chart
- CoinMarketCap
- Consider
- considered
- continue
- continues
- could
- Crash
- Crashing
- crypto
- Current
- decisions
- decrease
- Despite
- Dip
- Dominate
- Drop
- engage
- Enter
- expected
- external
- Fall
- financial
- financial advice
- flow
- following
- For
- from
- further
- future
- Give
- Goals
- Growth
- Hard
- Have
- High
- highly
- hold
- horizon
- HOURS
- HTTPS
- in
- increased
- index
- indicate
- indicates
- Indicators
- internal
- investment
- investment goals
- Investors
- IT
- ITS
- levels
- likely
- Line
- Long
- long-term
- looking
- Low
- Making
- Market
- Market Capitalization
- market correction
- Market News
- max-width
- May..
- Momentum
- money
- most
- movement
- news
- now
- of
- on
- ongoing
- opportunities
- Opportunity
- or
- overall
- past
- Pattern
- People
- performance
- plato
- Plato Data Intelligence
- PlatoData
- points
- positions
- positive
- possible
- potential
- press
- pressure
- price
- Price Analysis
- price chart
- Prices
- probably
- profits
- proof
- proof about
- range
- rating
- reaching
- recent
- recession
- relative strength index
- relatively
- research
- Results
- Reversal
- Ripple
- Ripple News
- rsi
- Selling
- severe
- shift
- Short
- short-term
- Shortly
- should
- Shows
- Signal
- significant
- since
- small
- Source
- South
- stay
- steady
- strength
- structure
- Suggests
- support
- support levels
- taking
- that
- The
- this
- time
- to
- Traders
- Trading
- trading volume
- TradingView
- Trend
- upward
- value
- vital
- volatile
- Volatility
- volume
- Waiting
- Watch
- while
- WHO
- will
- with
- within
- xrp
- XRP (XRP)
- XRP Price
- XRP price analysis
- XRP/USD
- zephyrnet
- zero


