Published 5 hours ago
The cryptocurrency market struggling to follow its early week recovery indicates the market is still in a state of uncertainty, as several crypto coins failed to surpass the last swing high resistance, then the possibility of further correction persists. However, despite a correction phase in the market, some altcoins maintained a bullish pattern which could bolster buyers to prolong the prevailing uptrend.
advertisement
Polygon(MATIC)

 Source- Tradingview
On February 15th, the MATIC coin price gives a massive record from a $1.3 neckline of rounding bottom pattern. This bullish reversal pattern is a sign of sustained recovery and trend reversal.
Thus, the aforementioned breakout may offer buyers a strong footing to climb higher levels. As of now, the polygon coin price trades at $1.54, with an intraday gain of 1.4%. However, the price may revert lower and retest the $1.46 or $1.3 to check the sustainability above the newly reclaimed support.
Trending Stories
Thus, if the buying pressure persists, the post-correction rally may signal a bull run to $1.86
Ripple(XRP)

 Source- Tradingview
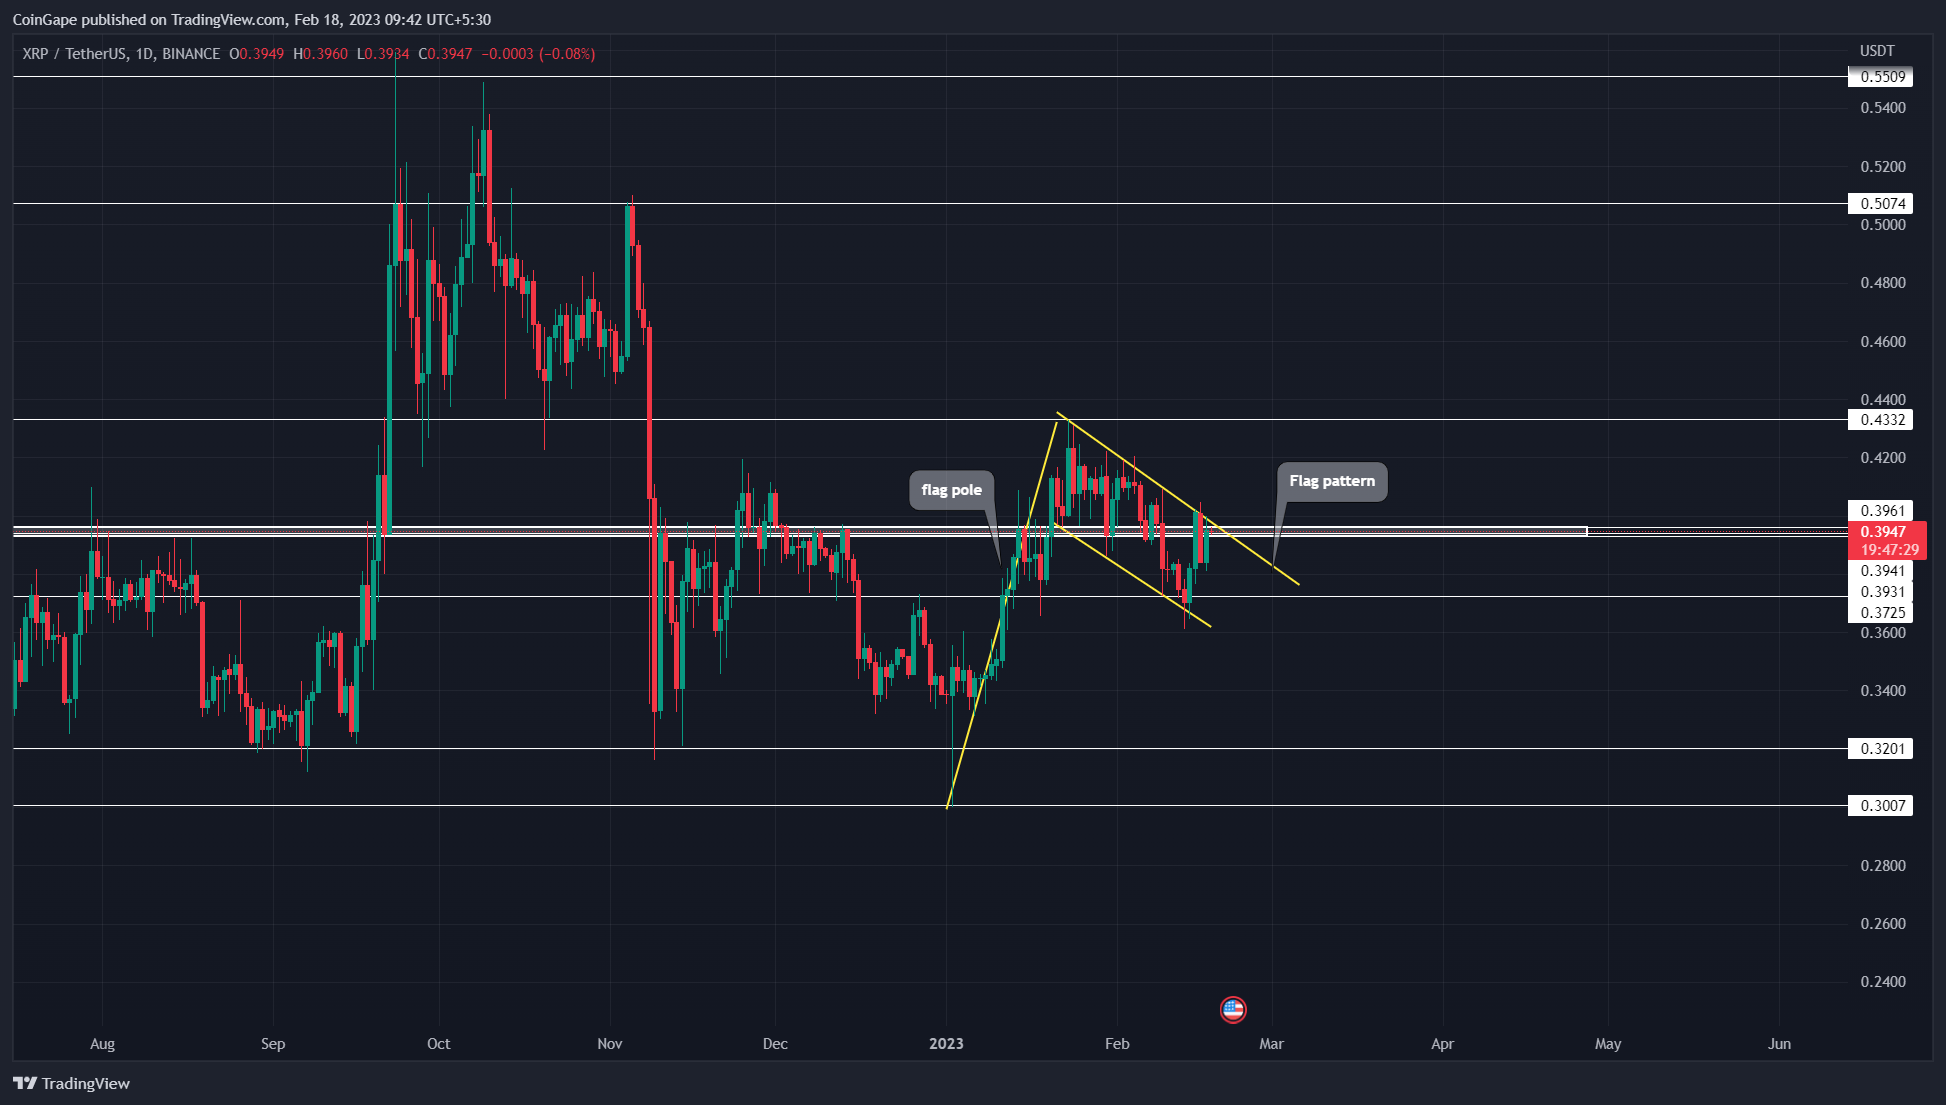
With a series of lower highs and lower lows, the XRP coin price has shown a steady correction phase for nearly a month. However, this downfall is part of a famous bullish pattern called the ‘flag.’
In theory, theory, a correction phase during this pattern formation offers a short retesting period before the next recovery cycle begins.
By the press time, the XRP price trades at $0.39 with an intraday loss of 0.05%. Thus, under the influence of the flag pattern, the coin price is poised to break the overhead resistance trendline. This potential breakout may signal the replenished bullish momentum and the start of the post-correction rally.
Under a favorable bullish scenario, this potential bull run could surpass the $0.5 mark.
Cosmos(ATOM)

 Source- Tradingview
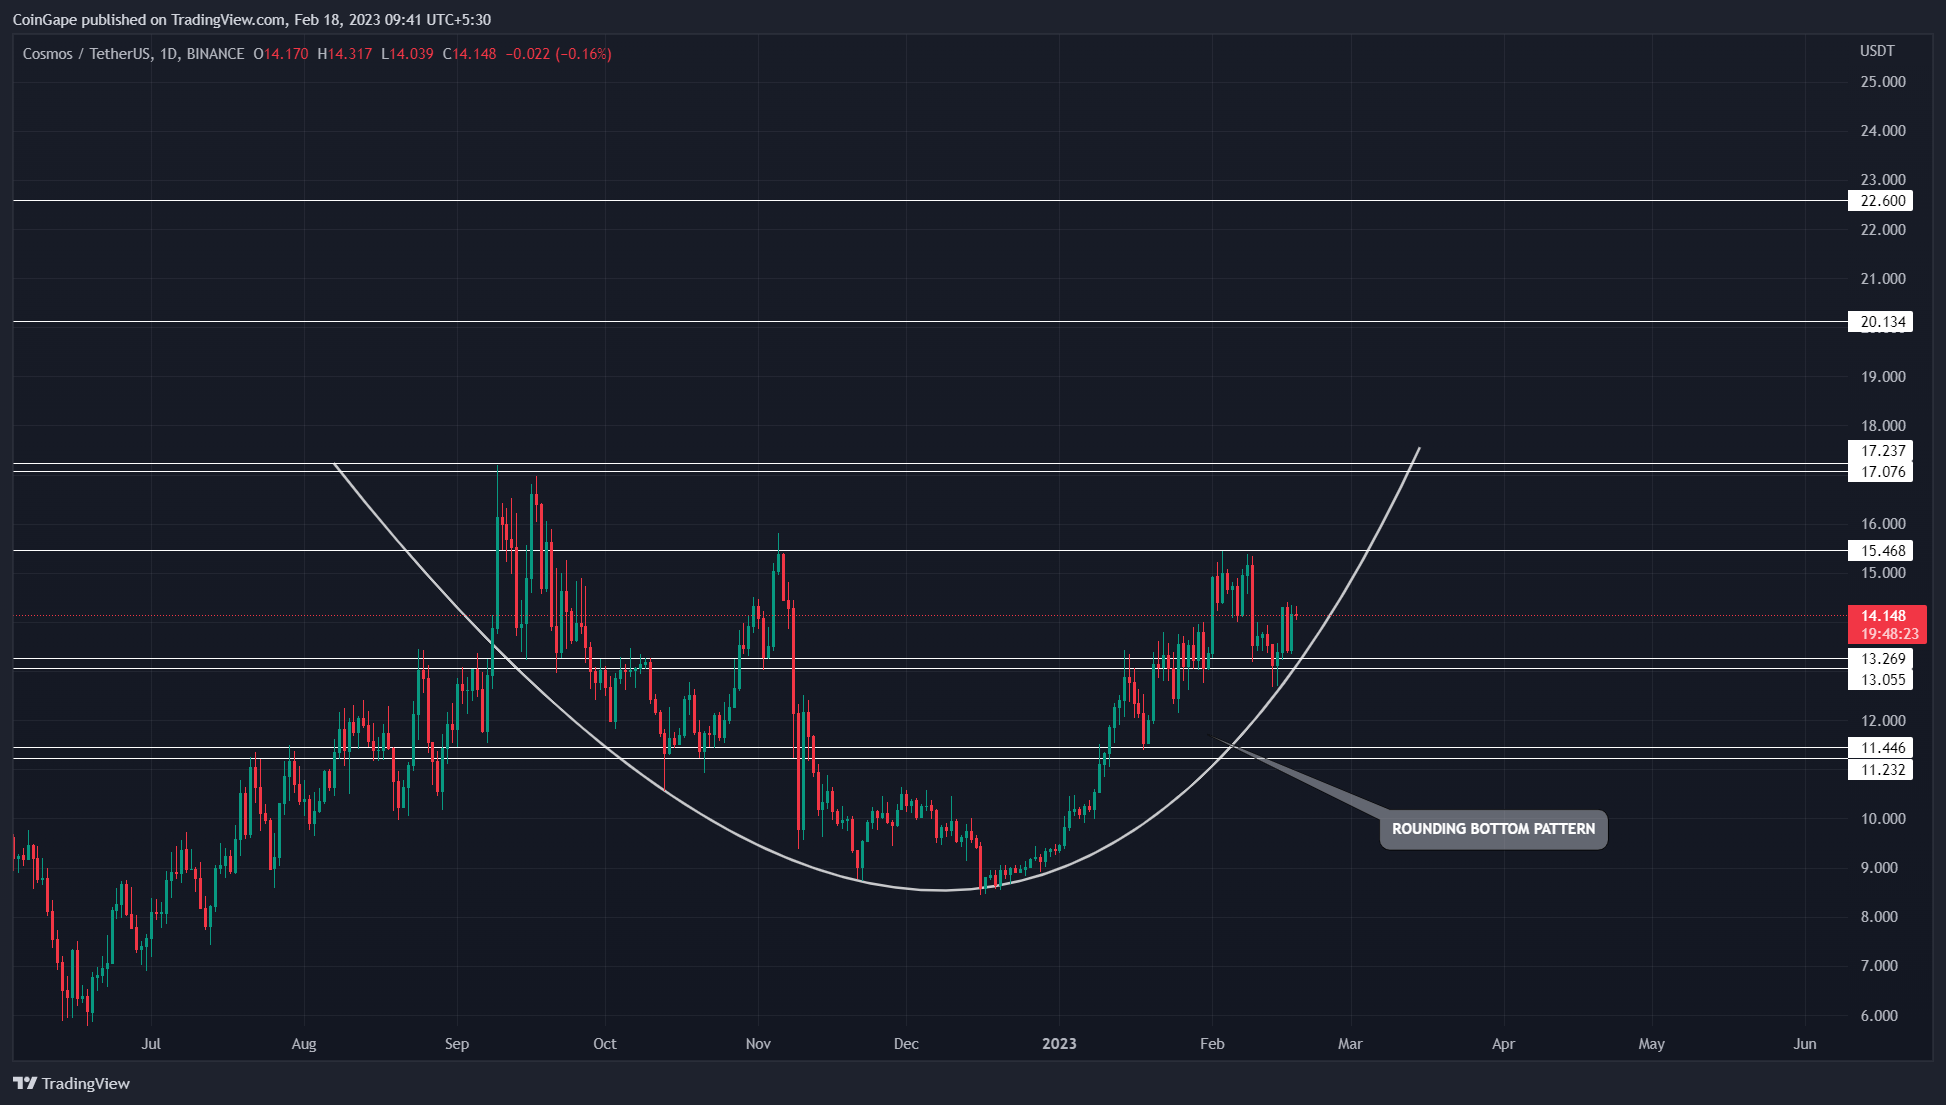
Over the past three months, the Cosmos coin showed a simple formation of a rounding bottom pattern. Under the influence of this pattern, the coin price has rallied 67.8% since January 1st and marked a local top at $15.46.
However, amid the recent correction phase in the crypto market, the ATOM price showed a minor pullback to $13 support. Furthermore, the coin price has to manage to rebound from this pattern, indicating the market sentiment is focusing on buying in dips.
advertisement
By the press time, the ATOM price trades at $14.1, but with the sustained buyer, it should surpass the $15.46 neckline resistance. This potential breakout could drive a significant bull run aiming for the $26 mark.
Share this article on:
advertisement
The presented content may include the personal opinion of the author and is subject to market condition. Do your market research before investing in cryptocurrencies. The author or the publication does not hold any responsibility for your personal financial loss.
<!– Close Story–>
- SEO Powered Content & PR Distribution. Get Amplified Today.
- Platoblockchain. Web3 Metaverse Intelligence. Knowledge Amplified. Access Here.
- Source: https://coingape.com/markets/top-3-altcoins-with-a-bullish-pattern-could-explode-in-coming-weeks/
- 1
- 10
- 39
- 67
- 7
- 9
- a
- above
- Ad
- Aiming
- Altcoins
- Amid
- and
- article
- atom
- ATOM price
- author
- avatar
- banner
- Beauty
- before
- blockchain
- bolster
- Bottom
- Break
- breakout
- Brian
- bull
- Bull Run
- Bullish
- buyers
- Buying
- called
- Chart
- check
- climb
- Coin
- Coingape
- Coins
- COM
- coming
- coming weeks
- condition
- content
- correction phase
- Cosmos
- could
- crypto
- Crypto Coins
- Crypto Market
- cryptocurrencies
- cryptocurrency
- cryptocurrency market
- cycle
- Despite
- different
- downfall
- drive
- during
- Early
- Entertainment
- Failed
- famous
- Fashion
- February
- finance
- financial
- focusing
- follow
- formation
- from
- further
- Furthermore
- Gain
- gives
- High
- higher
- Highs
- hold
- HOURS
- However
- HTTPS
- in
- include
- Including
- indicates
- influence
- investing
- IT
- January
- journalism
- Last
- levels
- local
- loss
- Lows
- manage
- mark
- marked
- Market
- market research
- market sentiment
- massive
- Matic
- minor
- Momentum
- Month
- months
- nearly
- next
- offer
- Offers
- Opinion
- part
- past
- Pattern
- period
- persists
- personal
- phase
- plato
- Plato Data Intelligence
- PlatoData
- plugin
- possibility
- potential
- presented
- press
- pressure
- price
- Publication
- pullback
- rally
- rebound
- recent
- record
- recovery
- research
- Resistance
- responsibility
- Reversal
- revert
- Run
- scenario
- sentiment
- Series
- several
- Share
- Short
- should
- shown
- sign
- Signal
- significant
- Simple
- since
- some
- start
- State
- steady
- Still
- strong
- Struggling
- subject
- support
- surpass
- Sustainability
- The
- three
- time
- to
- top
- Topics
- trades
- TradingView
- Trend
- trending
- Uncertainty
- under
- uptrend
- variety
- week
- Weeks
- which
- working
- written
- xrp
- XRP Price
- years
- Your
- zephyrnet


