- Last week’s broad-based US dollar strength has dissipated ex-post US non-farm payroll data with the continuation of its underperformance against the GBP.
- The US labour market has started to show growing slack where the labour force participation rate has dipped to 62.5%, its largest monthly decline in almost three years and full-time employment recorded its steepest drop since April 2020.
- Bearish reversal conditions seen on the USD/JPY after the prior 5-day rebound suggest the potential continuation of medium-term JPY strength.
- Watch the 146.70 key resistance of USD/JPY.
This is a follow-up analysis of our prior report, “USD/JPY Technical: Countertrend USD rebound remains intact ahead of US NFP” published on 5 January 2023. Click here for a recap.
The price actions of USD/JPY have pierced upwards as expected to print an intraday high of 145.98 in last Friday, 5 January (72 pips shy of the 146.70 key resistance as highlighted in our earlier analysis) upon the release of the US non-farm payrolls (NFP) data for December; the headline number of jobs added rose more than expected (+216K versus +170K consensus), and above the downward revised +173K in November.
Overall, the total jobs gain in the US for 2023 hit 2.7 million, the smallest annual gain since 2019 excluding the Covid pandemic year of 2020, and December’s +216K added jobs was still slightly below the 12-month average of +225K.
Growing slack in the US labour market
Also, the other key components of the jobs report have been lacklustre as highlighted by a steep drop in the labour force participation rate where it declined by 0.3 percentage points to 62.5% in December, the largest monthly decline in almost three years. In addition, full-time employment decreased to 133,196K in December from 134,727K in November, the steepest drop since April 2020.
Overall, the mixed US jobs report for December has indicated the prior US Federal Reserve’s interest rate hike cycle has started to inflict some adverse impact on the labour market which in turn keeps the expectation of a Fed dovish pivot “alive” in 2024.
US 2-year Treasury yield premium shrinkage is supporting a fresh leg of potential USD weakness
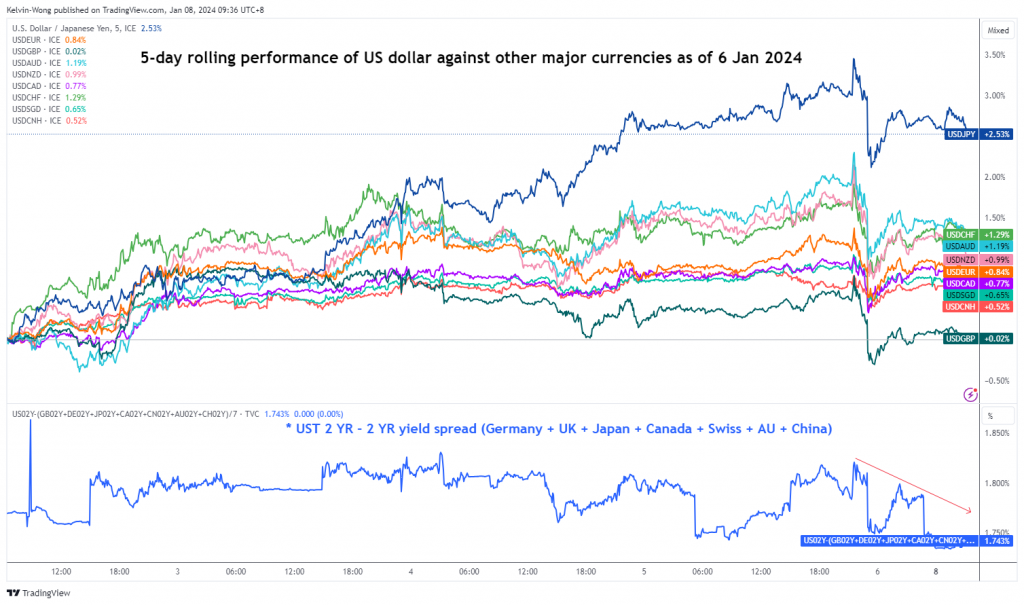
The US dollar strength has dissipated ex-post NFP release where the USD/JPY (the strongest USD outperformer) declined from a peak of +3.5% printed last week to +2.6% based on a 5-day rolling performance basis at this time of the writing.
Also, the USD has continued its underperformance against the GBP (unchanged for now).
The yield premium shrinkage of the US 2-year treasury yield over the rest of the world’s 2-year sovereign bond yields (an equal average of Germany, UK, Japan, Canada, Switzerland, Australia & China) has reinforced the current bullish exhaustion seen in the US dollar strength where it has declined by 9 basis points to 1.74% from a peak of 1.83% printed last week.
Bearish reversal conditions emerged in USD/JPY
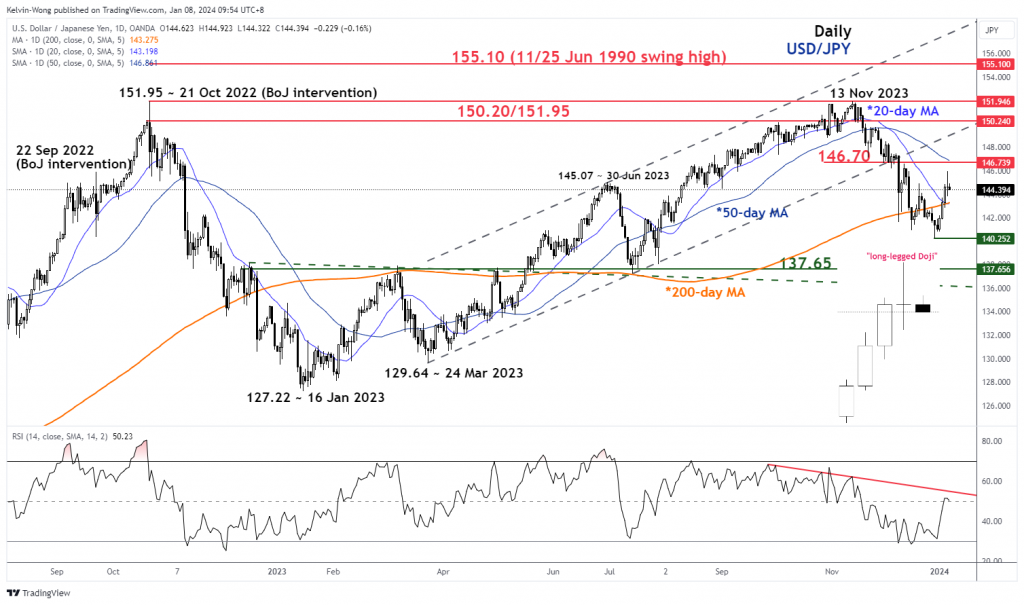
Fig 2: USD/JPY medium-term trend as of 8 Jan 2024 (Source: TradingView, click to enlarge chart)
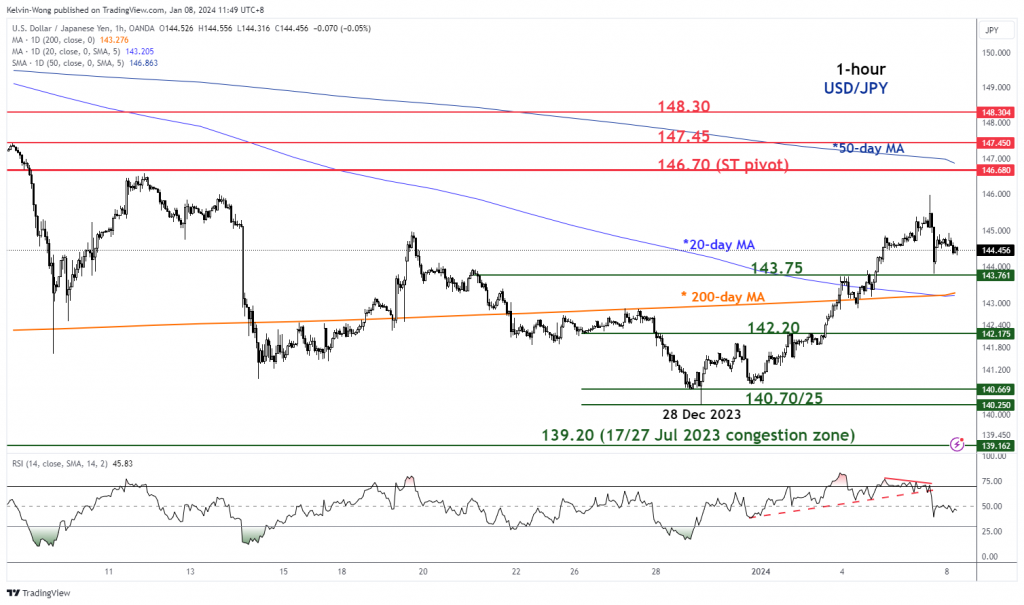
Fig 3: USD/JPY short-term minor trend as of 8 Jan 2023 (Source: TradingView, click to enlarge chart
The 5-day rebound of +573 pips/+4.9% that was seen in the USD/JPY from its 28 December 2023 minor swing low of 140.25 to last Friday, 5 January intraday high of 145.98 has almost reached a key inflection level of 146.70 (former swing low areas of 29 November/4 December 2023, downward sloping 50-day moving average & 50% Fibonacci retracement of the medium-term downtrend from 13 November 2023 high to 28 December 2023 low).
Last Friday, 5 January price actions of the USD/JPY formed a daily “long-legged Doji” candlestick by the end of the US session which suggests some form of exhaustion in the prior upmove sequence.
In addition, the upside momentum has also been eradicated in a shorter time frame as seen by the hourly RSI momentum indicator of the USD/JPY where it has broken down below a key parallel support at the 64 level after it flashed a bearish divergence at its overbought region.
Therefore, it is likely that the 5-day rebound from its 28 December 2023 low of 140.25 is more skewed towards a minor corrective rebound within a medium-term downtrend phase that is still intact for USD/JPY.
If the 146.70 key short-term pivotal resistance is not surpassed to the upside, a break below 143.75 may ignite a potential fresh impulsive downmove sequence to expose the next intermediate supports at 142.20 and 140.70/25 in the first step followed by 139.20 next.
On the flip side, a clearance above 146.70 invalidates the bearish scenario to see the next intermediate resistances coming in at 147.45 and 148.30.
Content is for general information purposes only. It is not investment advice or a solution to buy or sell securities. Opinions are the authors; not necessarily that of OANDA Business Information & Services, Inc. or any of its affiliates, subsidiaries, officers or directors. If you would like to reproduce or redistribute any of the content found on MarketPulse, an award winning forex, commodities and global indices analysis and news site service produced by OANDA Business Information & Services, Inc., please access the RSS feed or contact us at info@marketpulse.com. Visit https://www.marketpulse.com/ to find out more about the beat of the global markets. © 2023 OANDA Business Information & Services Inc.
- SEO Powered Content & PR Distribution. Get Amplified Today.
- PlatoData.Network Vertical Generative Ai. Empower Yourself. Access Here.
- PlatoAiStream. Web3 Intelligence. Knowledge Amplified. Access Here.
- PlatoESG. Carbon, CleanTech, Energy, Environment, Solar, Waste Management. Access Here.
- PlatoHealth. Biotech and Clinical Trials Intelligence. Access Here.
- Source: https://www.marketpulse.com/fundamental/usd-jpy-technical-us-dollar-strength-fizzled-out-ex-post-us-nfp/kwong
- :has
- :is
- :not
- :where
- 1
- 13
- 140
- 143
- 15 years
- 15%
- 20
- 2019
- 2020
- 2023
- 2024
- 25
- 28
- 29
- 30
- 7
- 70
- 700
- 72
- 75
- 8
- 9
- 98
- a
- About
- above
- access
- actions
- added
- addition
- adverse
- advice
- affiliates
- After
- against
- ahead
- almost
- also
- an
- Analyses
- analysis
- and
- annual
- any
- April
- ARE
- areas
- around
- AS
- At
- Australia
- author
- authors
- avatar
- average
- award
- based
- basis
- bearish
- bearish divergence
- beat
- been
- below
- bond
- Bond yields
- Box
- Break
- broad-based
- Broken
- Bullish
- business
- buy
- by
- Canada
- Chart
- China
- clearance
- click
- COM
- combination
- coming
- Commodities
- components
- conditions
- conducted
- Connecting
- Consensus
- contact
- content
- continuation
- continued
- courses
- Covid
- Current
- cycle
- daily
- data
- December
- Decline
- decreased
- Directors
- Divergence
- Dollar
- Dovish
- down
- downtrend
- downward
- Drop
- Earlier
- Elliott
- emerged
- employment
- end
- enlarge
- equal
- exchange
- excluding
- expectation
- expected
- experience
- expert
- Fed
- Federal
- Federal Reserve’s
- Fibonacci
- financial
- Find
- First
- Flip
- flow
- followed
- For
- Force
- foreign
- foreign exchange
- forex
- form
- formed
- Former
- found
- FRAME
- fresh
- Friday
- from
- fund
- fundamental
- Gain
- GBP
- General
- Germany
- Global
- global markets
- Growing
- Have
- headline
- High
- Highlighted
- Hike
- Hit
- HTTPS
- if
- Ignite
- Impact
- impulsive
- in
- Inc.
- indicated
- Indicator
- Indices
- Inflection
- inflict
- information
- interest
- INTEREST RATE
- interest rate hike
- investment
- IT
- ITS
- Jan
- January
- Japan
- Jobs
- jobs report
- JPY
- keeps
- Kelvin
- Key
- key resistance
- Labour
- largest
- Last
- Level
- levels
- like
- likely
- Low
- Macro
- Market
- market outlook
- market research
- MarketPulse
- Markets
- max-width
- May..
- million
- minor
- mixed
- Momentum
- monthly
- more
- moving
- moving average
- necessarily
- news
- next
- nfp
- Non-farm payrolls
- November
- now
- number
- numerous
- of
- officers
- on
- only
- Opinions
- or
- Other
- our
- out
- Outlook
- over
- pandemic
- Parallel
- participation
- passionate
- Payroll
- Payrolls
- Peak
- percentage
- performance
- perspectives
- phase
- photo
- Pivot
- pivotal
- plato
- Plato Data Intelligence
- PlatoData
- please
- points
- positioning
- Posts
- potential
- Premium
- price
- Prior
- Produced
- providing
- published
- purposes
- Rate
- Rate Hike
- reached
- rebound
- recap
- recorded
- region
- release
- remains
- report
- research
- Resistance
- REST
- retail
- retracement
- Reversal
- Rolling
- ROSE
- rsi
- rss
- scenario
- Securities
- see
- seen
- sell
- senior
- Sequence
- service
- Services
- session
- sharing
- short-term
- show
- shy
- side
- since
- Singapore
- site
- slack
- sloping
- solution
- some
- Source
- sovereign
- specializing
- started
- Step
- Still
- stock
- Stock markets
- Strategist
- strength
- strongest
- suggest
- Suggests
- support
- Supporting
- Supports
- surpassed
- Swing
- switzerland
- Technical
- Technical Analysis
- ten
- than
- that
- The
- this
- thousands
- three
- time
- to
- Total
- towards
- Traders
- Trading
- TradingView
- Training
- treasury
- Trend
- TURN
- Uk
- unique
- upon
- Upside
- upwards
- us
- US Dollar
- US Federal
- US Jobs Report
- us NFP
- USD
- USD/JPY
- using
- v1
- Versus
- Visit
- was
- Wave
- week
- WELL
- which
- winning
- with
- within
- wong
- world’s
- would
- writing
- year
- years
- Yield
- yields
- You
- zephyrnet


