XinFin Network is an enterprise-grade hybrid blockchain network that aims to promote global trade and finance. It is powered by smart contracts and has features of both public and private blockchains. It is a decentralized, interoperable, and Proof-of-Stake based ecosystem. XDC is the native token of this network. Below is the technical analysis for XDC:
Past Performance
On Jun 11, 2021, XDC opened at $0.05. On Jun 17, 2021, XDC closed at $0.07. Thus, in the past week, the XDC price has increased by roughly 40%. In the last 24 hours, XDC has traded between $0.06-$0.08.

Day-Ahead and Tomorrow
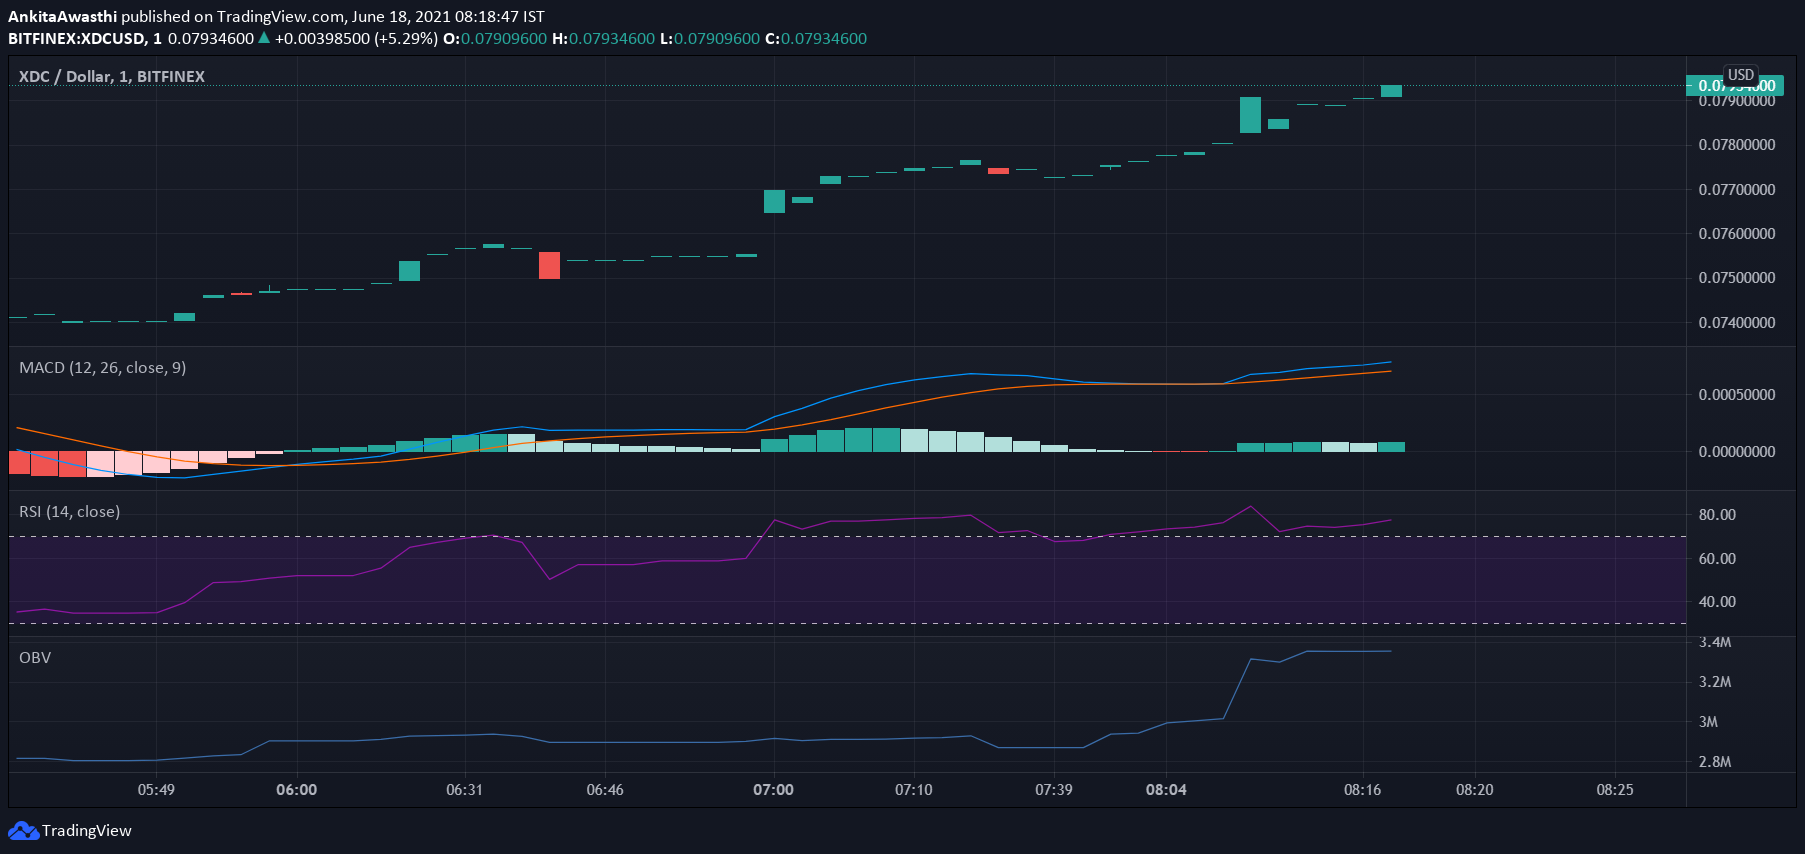
Currently, XDC is trading at $0.079. The price has increased from the day’s opening price of $0.07. Thus, the market seems bullish.
The MACD and signal lines are positive. Moreover, a bullish crossover by the MACD line over the signal line has occurred. Thus, the overall market momentum is bullish. Hence, we can expect the price to rise further.
Currently, the RSI indicator is at 81% – deep into the ‘overbought’ region. Hence, buying pressures are extremely high. Heavy demand for crypto will push its price upwards.
Besides, the OBV indicator is upward sloping. Thus, buying volumes are higher than selling volumes. The OBV indicator is giving further credence to the positive market momentum shown by the other two indicators. Thus, as of now, all three oscillators have given bullish signals.
XDC Technical Analysis
Currently, the price is above the first Fibonacci pivot resistance level of $0.077. It may soon break out of the subsequent Fibonacci pivot resistance levels of $0.082 and $0.091, respectively.
The price has tested and broken out of the 23.6% FIB retracement level of $0.074. The price may soon break out of the 23.6% FIB extension level of $0.084 as well. Thus, as of now, we can expect the strong bullish momentum to continue today as well as tomorrow.
- "
- 11
- active
- All
- analysis
- blockchain
- border
- breakout
- Bullish
- Buying
- closed
- continue
- contracts
- crypto
- decentralized
- Demand
- ecosystem
- Features
- Figure
- finance
- Giving
- Global
- High
- HTTPS
- Hybrid
- IT
- Level
- Line
- Market
- Momentum
- network
- Other
- Pivot
- Posts
- price
- private
- promote
- Proof-of-Stake
- public
- smart
- Smart Contracts
- Technical
- Technical Analysis
- token
- trade
- Trading


