SNEAK PEEK
- BTC token is slowly recovering above the $26,700 resistance.
- Bullish sentiment is rising as buying pressure increases.
- The token is up by 1.27 percent in the last few hours.
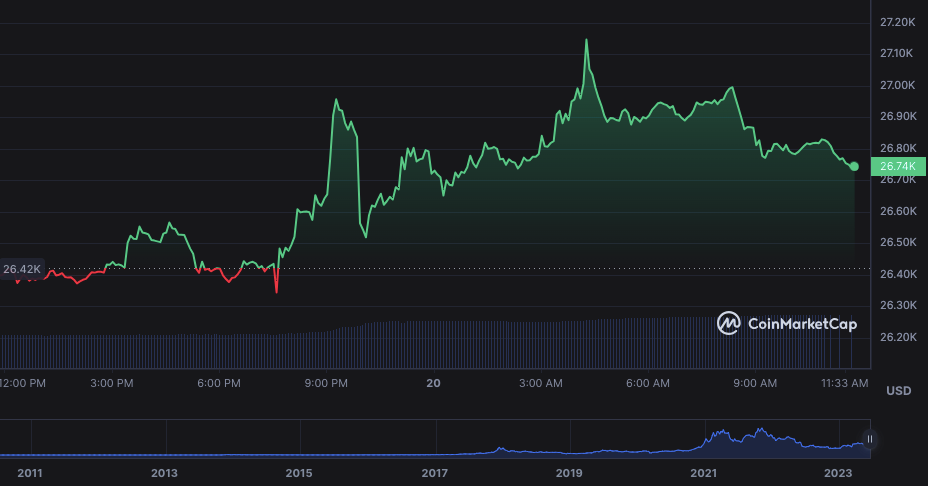
Bitcoin price analysis for today reveals that the market sentiment is recovering from the recent crash. The token is now trading above $26,700 support and continuing to move higher. Bullish pressure is increasing as the token approaches a key level near $27,000. BTC is currently up by 1.27 percent in the last few hours, trading at $26,812.

The strong resistance level is present at $27,000, and bulls will need to break past this level for any further gains. The buying pressure is increasing, with buyers pushing the prices higher. If BTC can break this level, it could make a strong rebound and recover most of its losses from the recent crash. On the downside, the major support level is present at $26,500, and any further losses below this level could push the prices lower.
The dominance of Bitcoin in the crypto market has increased significantly and has passed above 45 percent at 47.95 percent. The market capitalization of the token has reached $518,981,128,945, with a surge of 1.18 percent in the last 24 hours, while the trading volume is at $14,821,197,411, up by 62.34 percent, indicating that buyers are still in the market.
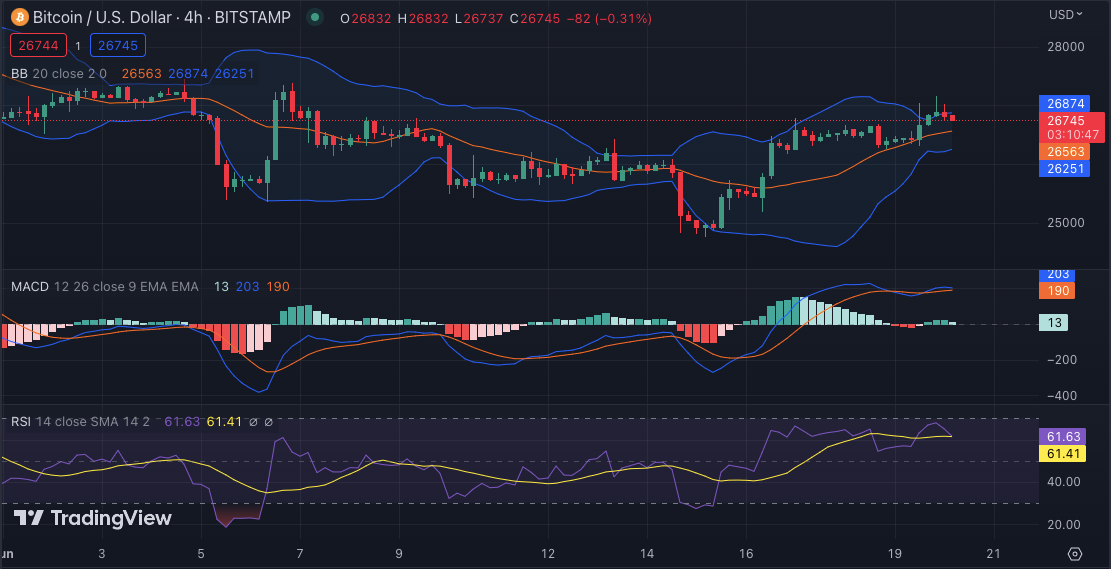
Looking at the technical indicators, the 20 EMA is rising and has crossed above the 50 EMA, which indicates that the bullish trend is now in control. The moving average convergence divergence (MACD) is also in the positive zone with a bullish crossover. The relative strength index (RSI) has also entered the neutral zone at 61.39.

The 4-hour Bollinger bands are expanding, suggesting that the volatility is increasing in the market. The upper Bollinger bands are now moving higher at 26,874, indicating that the token could extend its recovery in the near term, while the lower Bollinger band is at 26,251, which may act as a support for the token if bears step back in the market.
Overall, Bitcoin is recovering from the recent crash and is trading above the $26,700 support level. However, with a lack of momentum and an increasingly bearish market sentiment, it remains unclear what direction BTC will eventually take next. The bulls will need to push the token above the $27,000 resistance level for any further gains and build on its current momentum if BTC is to continue its recovery.
Disclaimer: Cryptocurrency price is highly speculative and volatile and should not be considered financial advice. Past and current performance is not indicative of future results. Always research and consult with a financial advisor before making investment decisions.
- SEO Powered Content & PR Distribution. Get Amplified Today.
- EVM Finance. Unified Interface for Decentralized Finance. Access Here.
- Quantum Media Group. IR/PR Amplified. Access Here.
- PlatoAiStream. Web3 Data Intelligence. Knowledge Amplified. Access Here.
- Source: https://investorbites.com/bitcoin-btc-price-analysis-20-06/
- :has
- :is
- :not
- $UP
- 000
- 1
- 20
- 22
- 24
- 26%
- 27
- 39
- 50
- 500
- 7
- a
- above
- Act
- advice
- advisor
- also
- always
- an
- analysis
- and
- any
- approaches
- ARE
- AS
- At
- average
- back
- BAND
- BE
- bearish
- bearish market
- Bears
- before
- below
- Bitcoin
- Bitcoin News
- Bitcoin Price
- Bitcoin Price Analysis
- Bollinger bands
- Break
- BTC
- BTC/USD
- build
- Bullish
- Bulls
- but
- buyers
- Buying
- by
- CAN
- cap
- capitalization
- Chart
- Coin
- Coin Market Cap
- Concerns
- considered
- continue
- continuing
- Convergence
- could
- Crash
- Crossed
- crypto
- Crypto Market
- Current
- Currently
- daily
- decisions
- direction
- Divergence
- Dominance
- downside
- EMA
- entered
- eventually
- expanding
- extend
- extends
- external
- few
- financial
- financial advice
- For
- from
- further
- future
- Gains
- higher
- highly
- HOURS
- However
- HTTPS
- if
- in
- Increases
- increasing
- increasingly
- index
- Indicators
- internal
- investment
- investor
- IT
- ITS
- Key
- Lack
- Last
- Level
- losses
- lower
- MACD
- major
- make
- Making
- Market
- Market Cap
- Market Capitalization
- Market News
- market sentiment
- May..
- Momentum
- most
- move
- moving
- moving average
- Near
- Need
- Neutral
- news
- next
- now
- of
- on
- passed
- past
- percent
- performance
- plato
- Plato Data Intelligence
- PlatoData
- positive
- present
- pressure
- price
- Price Analysis
- price chart
- Prices
- Push
- Pushing
- reached
- rebound
- recent
- Recover
- recovering
- recovery
- relative
- relative strength index
- remain
- remains
- research
- Resistance
- Results
- Reveals
- rising
- rsi
- sentiment
- should
- significantly
- Slowly
- speculative
- Step
- Still
- strength
- strong
- support
- support level
- surge
- Take
- Technical
- term
- that
- The
- this
- to
- today
- token
- Trading
- trading volume
- TradingView
- Trend
- volatile
- Volatility
- volume
- What
- What is
- What is bitcoin
- which
- while
- will
- with
- zephyrnet


