SNEAK PEEK
- ADA struggles to recover as bears dominate the market, pushing prices down.
- Cautious investors contribute to ADA’s decline amid uncertainty.
- Negative market indicators suggest potential further price drops for ADA.
The Cardano (ADA) market dropped sharply during the past 24 hours, and recovery attempts were fruitless because the $0.2687 intraday high was a strong resistance level. During the decline, the bears successfully drove the price of ADA from its peak to an intraday low of $0.2587, where it found support.
The price of Cardano fell to $0.2616 as of the time of writing, a 2.00% loss from the previous close, as the bears continued to dominate the market. Investors who stand to gain from the price increase and who are cashing out on their gains are the ones who are applying more selling pressure to ADA.
ADA’ ‘s market capitalization decreased by 2.00% to $9,136,815,343, and the 24-hour trading volume decreased by 12.47% to $126,379,513. Investors who closely monitor the ADA market and hold off on making sizable investments until they see a recovery are to blame for this decline due to their uncertainty and caution.
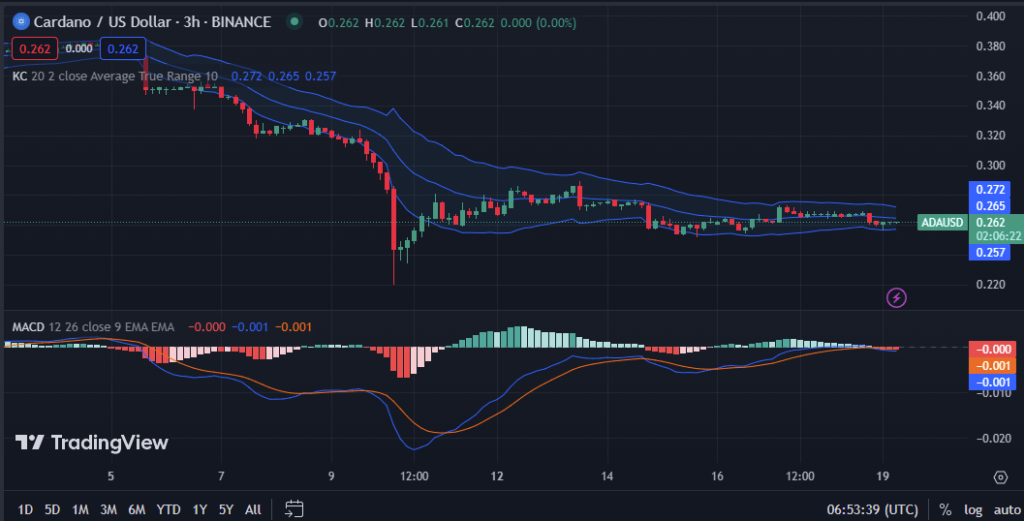
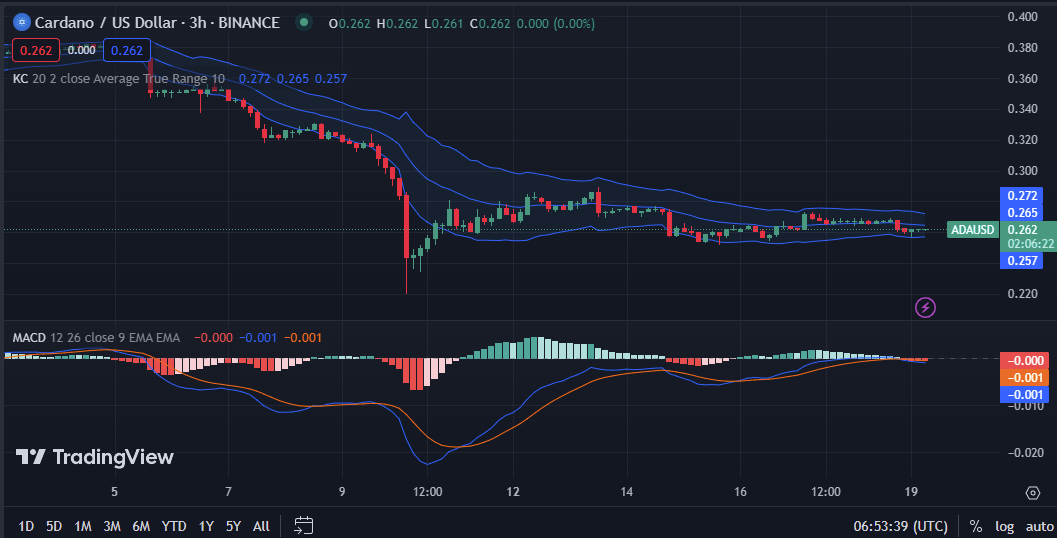
On the 3-hour price chart for the ADA market, the MACD blue line has a -0.001 reading below the signal line and in the negative region. Investors should consider selling their ADA tokens or waiting for the price to drop before repurchasing them, given that this move implies a bearish trend in the market.
The Keltner Channel bands are moving South with the top bar at 0.27 and the bottom bar at 0.26. This pattern shows that the price of ADA could drop further and soon approach the lower support level.
This viewpoint is supported by the price action movement, which forms red candlesticks toward the bottom band. A reversal or recovery may occur if the price movement continues this way and breaches the lower band, which denotes that the market is oversold.

The Chaikin Money Flow (CMF) value of -0.13 on the 3-hour price chart is in the negative region, suggesting more selling pressure than buying pressure on the ADA market. This level shows that investors are currently selling ADA more than they are buying it, which, if the pattern continues, might cause more price falls.
ADA is currently oversold and may undergo a brief rebound, according to the Know Sure Thing (KST) reading of 0.3133 and movement below the signal line on the 3-hour price chart. However, this may be a relief rally rather than reversing the long-term trend, so traders should be cautious.

In conclusion, with bears dominating the Cardano (ADA) market and cautious investors adding to the struggle, ADA faces uncertainty and potential further price drops, urging traders to exercise caution in their decisions.
Disclaimer: Cryptocurrency price is highly speculative and volatile and should not be considered financial advice. Past and current performance is not indicative of future results. Always research and consult with a financial advisor before making investment decisions.
- SEO Powered Content & PR Distribution. Get Amplified Today.
- EVM Finance. Unified Interface for Decentralized Finance. Access Here.
- Quantum Media Group. IR/PR Amplified. Access Here.
- PlatoAiStream. Web3 Data Intelligence. Knowledge Amplified. Access Here.
- Source: https://investorbites.com/cardano-ada-price-analysis-19-06/
- :has
- :is
- :not
- :where
- 12
- 13
- 15%
- 22
- 24
- 26%
- 27
- 7
- a
- According
- Action
- ADA
- ADA/USD
- adding
- advice
- advisor
- always
- Amid
- an
- analysis
- analyzing
- and
- Applying
- approach
- ARE
- AS
- At
- Attempts
- BAND
- bar
- BE
- bearish
- Bears
- because
- before
- below
- blockchain
- Blue
- Bottom
- breaches
- Buying
- by
- candlesticks
- capitalization
- Cardano
- Cardano (ADA)
- Cardano News
- cardano price
- Cardano price analysis
- cashing
- Cause
- caution
- cautious
- Channel
- Chart
- Close
- closely
- conclusion
- Consider
- considered
- continued
- continues
- contribute
- could
- Current
- Currently
- decisions
- Decline
- Dominate
- down
- Drop
- dropped
- Drops
- due
- during
- Exercise
- faces
- Falls
- financial
- financial advice
- flow
- For
- forms
- found
- from
- further
- future
- Gain
- Gains
- given
- High
- highly
- hold
- HOURS
- However
- HTTPS
- if
- in
- Increase
- Indicators
- internal
- investment
- Investments
- investor
- Investors
- IT
- ITS
- Know
- Level
- Line
- long-term
- loss
- Low
- lower
- MACD
- Making
- Market
- Market Capitalization
- Market News
- max-width
- May..
- might
- money
- Monitor
- more
- move
- movement
- moving
- negative
- news
- of
- off
- on
- ones
- or
- out
- past
- Pattern
- Peak
- performance
- plato
- Plato Data Intelligence
- PlatoData
- potential
- pressure
- previous
- price
- PRICE ACTION
- Price Analysis
- price chart
- Price Increase
- Prices
- Pushing
- rally
- rather
- Reading
- rebound
- Recover
- recovery
- Red
- region
- relief
- research
- Resistance
- Results
- Reversal
- see
- Selling
- should
- Shows
- Signal
- sizable
- So
- soon
- Source
- South
- speculative
- stand
- strong
- Struggle
- Struggles
- Successfully
- suggest
- support
- support level
- Supported
- than
- that
- The
- their
- Them
- they
- thing
- this
- time
- to
- Tokens
- top
- toward
- Traders
- Trading
- trading volume
- TradingView
- Trend
- Uncertainty
- undergo
- until
- urging
- value
- volatile
- volume
- Waiting
- was
- Way..
- were
- What
- What is
- which
- WHO
- with
- writing
- zephyrnet


