SNEAK PEEK
- Robust ETH momentum defies downward pressure, signaling an upward trend.
- Buyers dominate as ETH resists price decline, hinting at bullish market sentiment.
- ETH’s positive momentum persists despite the lower trading volume, indicating resilience.
In the last 24 hours, the Ethereum (ETH) market has shown remarkable resilience, with a robust positive momentum that has defied any efforts to decrease prices. Throughout this period, there were precise levels of support at $1,878.72 and resistance at $1,918.12, indicating the consistent upward movement of ETH’s price.
Most investors being buyers further strengthens the bullish sentiment in the market, suggesting that ETH may soon resume its upward trajectory. During this writing, ETH experienced a 0.45% increase compared to the previous closing price, reaching $1,908.79.
ETH’s market capitalization saw a modest increase of 0.44% to reach $229,409,523,426 in the last 24 hours. However, there was a noticeable decline in trading volume, dropping by 14.18% to $5,862,446,795. This decrease in trading volume suggests reduced market activity and liquidity for ETH during this period.
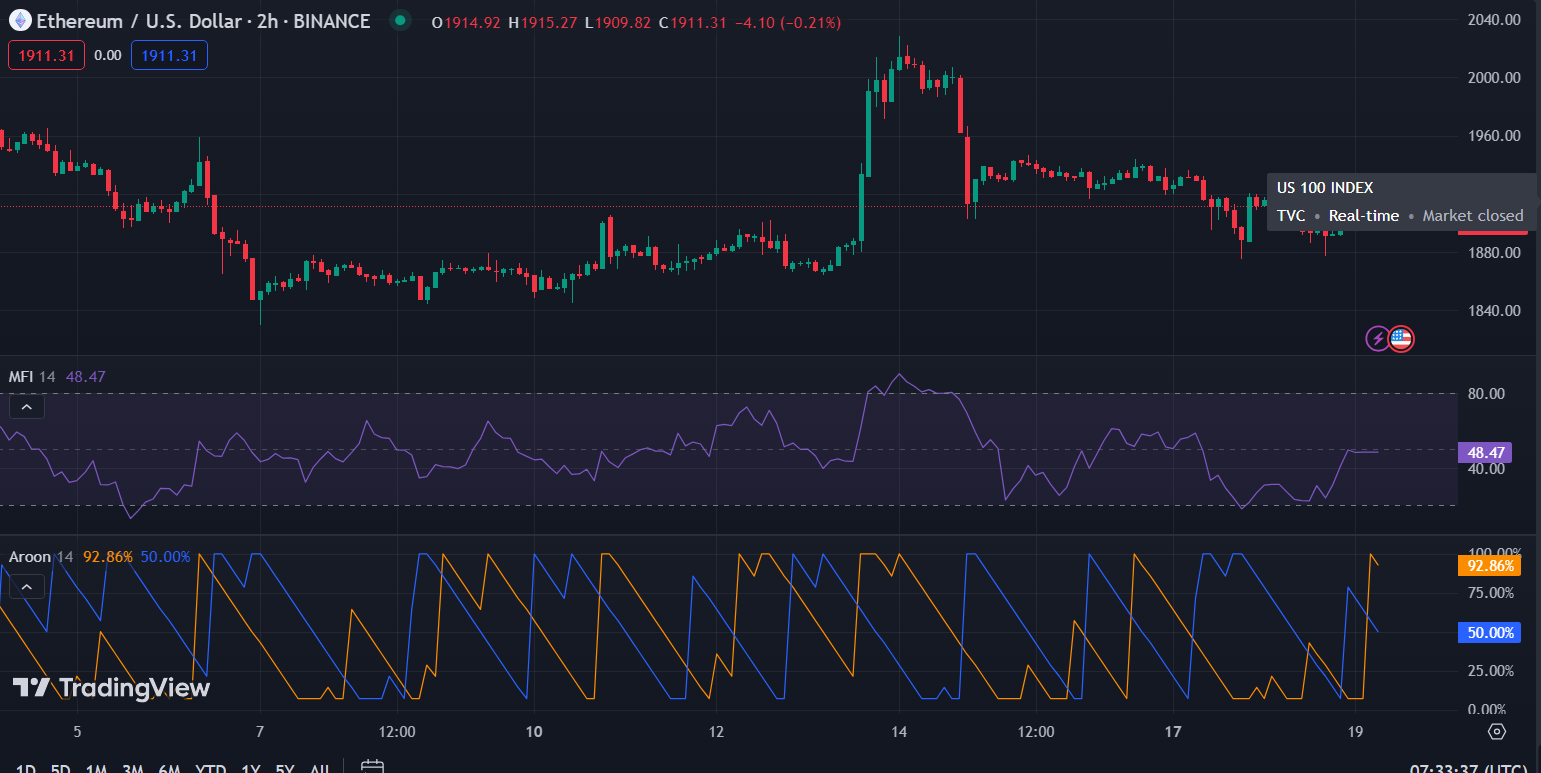
According to the values for the Aroon up and down on the 2-hour price chart for ETH, which is 92.86% and 50.00%, respectively, the trend is solid and likely to last for some time, despite the possibility of brief reversals along the way, allowing traders to identify potential entry and exit points for trades.
The money flow index (MFI) line on the ETH market price chart has a value of 48.47 and is sloping downward. This action indicates a substantial outflow of capital from the ETH market and the start of a short-term adverse trend. The ETH market is moderately volatile because prices will likely fluctuate within a limited range.

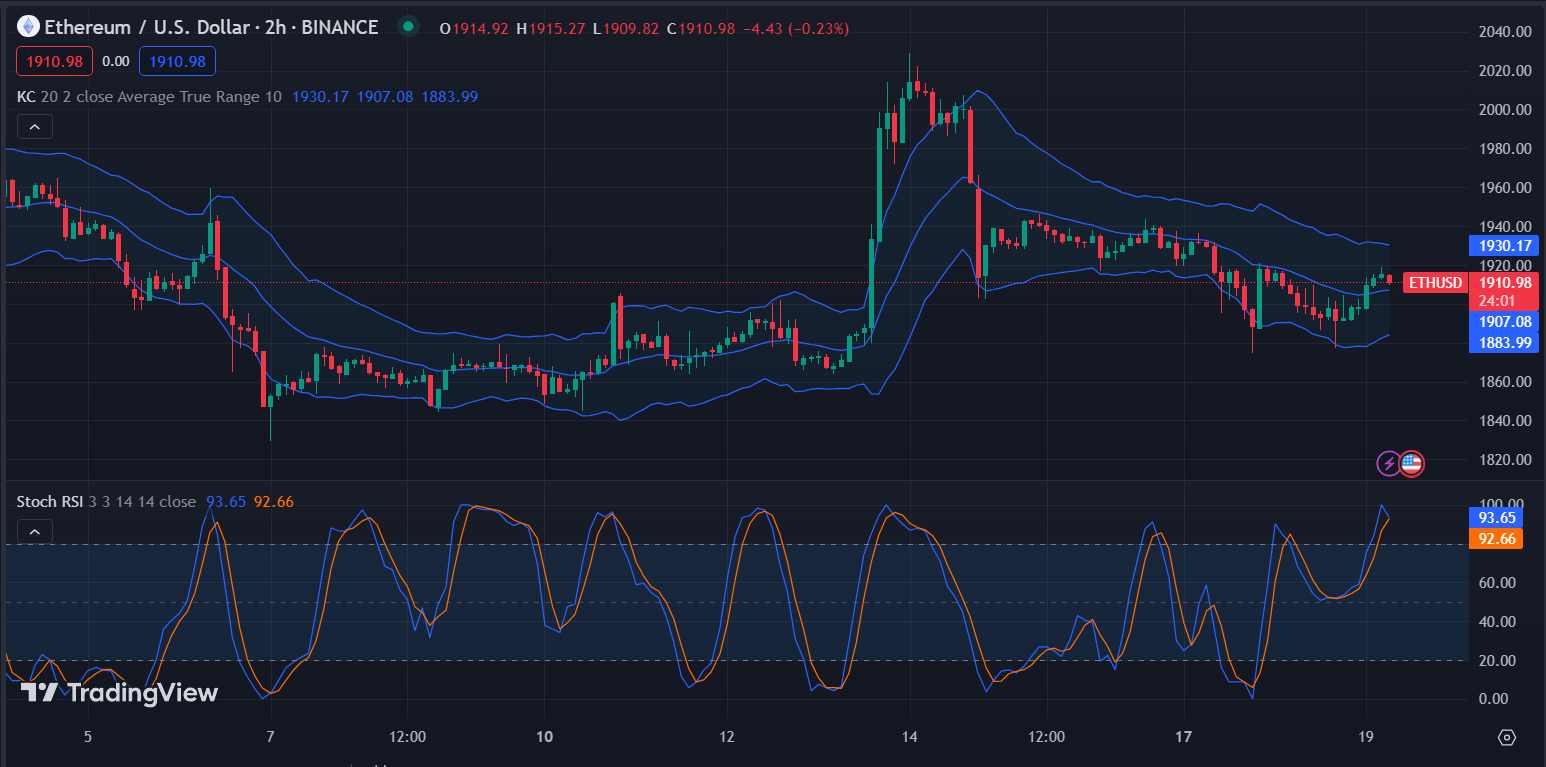
The upper and lower Keltner Channel band readings are 1930.17 and 1883.93, respectively, on the 2-hour price chart for ETH, indicating a bullish trend. With a sell target price near the upper Keltner Channel, investors may contemplate purchasing ETH at the current price.
The formation of green candlesticks on the ETH price chart and the price action movement to the middle band bolster the bullish momentum. Traders should know potential resistance levels and utilize a stop loss to mitigate risk if the bull’s strength wanes.
On the 2-hour price chart for ETH, a Stochastic RSI reading of 93.65 and price movement above its signal line indicate bullish market momentum. This action suggests that the buyers are controlling the market and that further ETH price increases are possible.

In conclusion, ETH’s robust positive momentum, dominated by buyers and resisting price decline, points to a potential upward trend in the market. Bullish sentiment persists despite the lower trading volume, highlighting ETH’s resilience.
Disclaimer: Cryptocurrency prices are highly speculative and volatile and should not be considered financial advice. Past and current performance are not indicative of future results. Always research and consult with a financial advisor before making investment decisions.
- SEO Powered Content & PR Distribution. Get Amplified Today.
- PlatoData.Network Vertical Generative Ai. Empower Yourself. Access Here.
- PlatoAiStream. Web3 Intelligence. Knowledge Amplified. Access Here.
- PlatoESG. Automotive / EVs, Carbon, CleanTech, Energy, Environment, Solar, Waste Management. Access Here.
- BlockOffsets. Modernizing Environmental Offset Ownership. Access Here.
- Source: https://investorbites.com/ethereum-eth-price-analysis-19-07/
- :has
- :is
- :not
- $UP
- 12
- 14
- 17
- 1930
- 22
- 24
- 50
- 72
- a
- above
- Action
- activity
- adverse
- advice
- advisor
- against
- Allowing
- along
- always
- an
- analysis
- and
- any
- ARE
- AS
- At
- BAND
- BE
- because
- before
- being
- bolster
- Bullish
- Bulls
- buyers
- by
- candlesticks
- capital
- capitalization
- Channel
- Chart
- closing
- compared
- conclusion
- considered
- consistent
- controlling
- Current
- decisions
- Decline
- decrease
- defied
- Despite
- discussion
- Dominate
- down
- downward
- Dropping
- during
- efforts
- entry
- ETH
- eth market
- eth price
- ETH/USD
- ethereum
- Ethereum News
- Ethereum Price
- Ethereum Price Analysis
- Exit
- experienced
- extensive
- financial
- financial advice
- flow
- fluctuate
- For
- formation
- from
- further
- future
- Green
- highlighting
- highly
- HOURS
- However
- HTTPS
- identify
- if
- in
- Increase
- Increases
- index
- indicate
- indicates
- internal
- investment
- investor
- Investors
- ITS
- Know
- Last
- levels
- likely
- Limited
- Line
- Liquidity
- loss
- lower
- Making
- Market
- Market Capitalization
- Market News
- May..
- Middle
- Mitigate
- moderately
- modest
- Momentum
- money
- movement
- Near
- news
- of
- on
- past
- performance
- period
- persists
- plato
- Plato Data Intelligence
- PlatoData
- points
- positive
- possibility
- possible
- potential
- precise
- pressure
- previous
- price
- PRICE ACTION
- Price Analysis
- price chart
- Prices
- purchasing
- range
- reach
- reaching
- Reading
- Reduced
- remarkable
- research
- resilience
- Resistance
- respectively
- Results
- resume
- Risk
- robust
- rsi
- saw
- sell
- sentiment
- short-term
- should
- shown
- Signal
- sloping
- Soars
- solid
- some
- soon
- Source
- speculative
- start
- Stop
- strength
- substantial
- Suggests
- support
- Target
- that
- The
- There.
- this
- throughout
- time
- to
- Traders
- trades
- Trading
- trading volume
- TradingView
- trajectory
- Trend
- upward
- utilize
- value
- Values
- volatile
- volume
- was
- Way..
- were
- What
- What is
- which
- will
- with
- within
- writing
- zephyrnet


