SNEAK PEEK
- Bulls dominate the SHIB market, pushing prices higher despite bearish attempts.
- SHIB’s impressive 4.97% surge showcases strong market performance.
- Positive sentiment and momentum drive SHIB’s potential for gains.
Despite attempts by the bears to push down the prices, the bulls gained control in the Shiba Inu (SHIB) market over the past 24 hours, leading to a surge in prices from an intraday low of $0.000008174 to an intraday high of $0.000008431.
As a result of this ongoing positive trend, the price of SHIB experienced a remarkable 4.97% increase, reaching $0.000008614 at the time of this update. Additionally, SHIB’s market capitalization and 24-hour trading volume showed significant growth, rising by 2.38% and 17.20%, respectively, reaching $5,028,768,765 and $143,286,027.
This impressive upswing in market value and trading volume for SHIB indicates a substantial boost in its overall market performance, likely fueled by prevailing positive market sentiment.
According to the 4-hour price chart of SHIB, the Aroon indicators show a significant trend, with Aroon up at 100.00% and Aroon down at 28.57%. This move suggests a strong and lasting movement in the market, though there might be occasional minor reversals. Traders can use this information with valuable insights to pinpoint their trades’ potential entry and exit levels.
Furthermore, the Chaikin Money Flow (CMF) value of 0.22 in the SHIB market indicates a positive trend. The CMF line points upwards, indicating a favourable outlook for the coin’s future performance. The positive CMF value implies that more investors buy SHIB tokens than selling, resulting in a higher capital inflow than outflow.
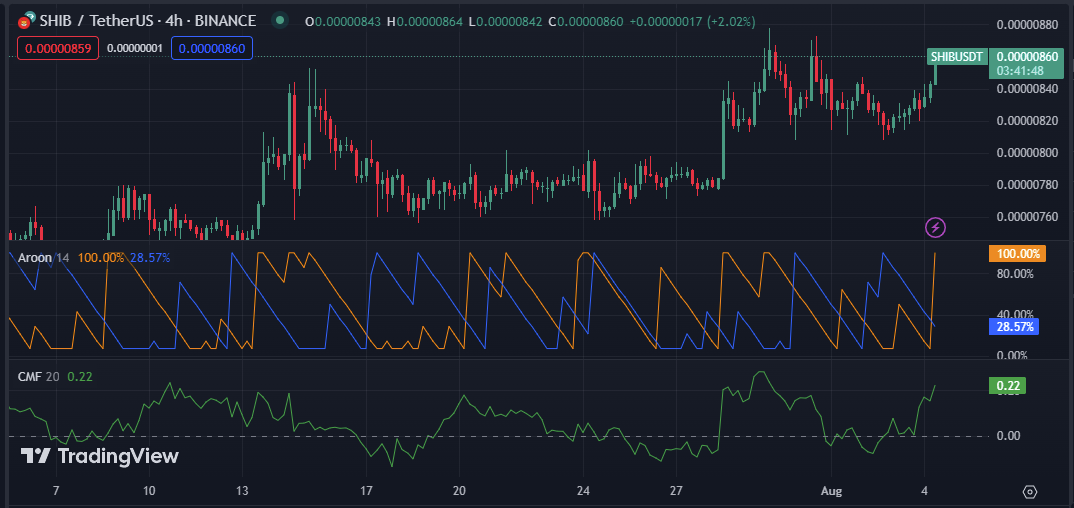
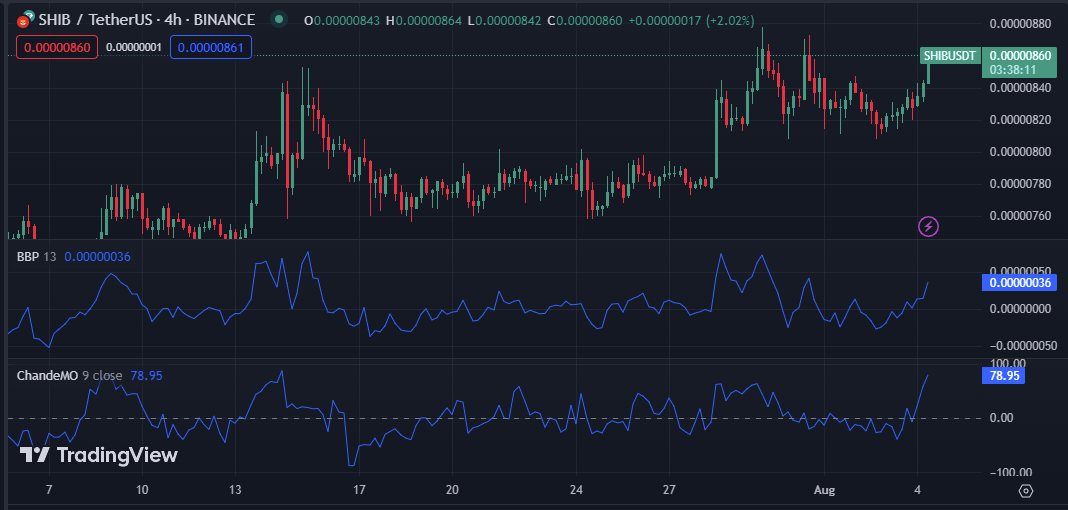
Based on the Bull Bear Power value of 0.00000036, the market’s buying power slightly outweighs its selling power. The increasing trend in the Bull Bear Power indicator is proving valuable for traders as it aids in making well-informed decisions and accurately predicting market patterns. This, in turn, leads to profitable trades and boosts confidence in their investment strategies.
The Chande Momentum Oscillator (ChandeMo) on the 4-hour price chart of SHIB is pointing upwards with a positive value of 78.95. This movement indicates a strong momentum and a bullish trend, suggesting that buyers are currently in control and there is a high likelihood of prices continuing to rise in the near future.
In conclusion, SHIB’s bullish charge shows no signs of slowing down! Positive sentiment and strong momentum hint at more gains on the horizon.
Disclaimer: Cryptocurrency price is highly speculative and volatile and should not be considered financial advice. Past and current performance is not indicative of future results. Always research and consult with a financial advisor before making investment decisions.
- SEO Powered Content & PR Distribution. Get Amplified Today.
- PlatoData.Network Vertical Generative Ai. Empower Yourself. Access Here.
- PlatoAiStream. Web3 Intelligence. Knowledge Amplified. Access Here.
- PlatoESG. Automotive / EVs, Carbon, CleanTech, Energy, Environment, Solar, Waste Management. Access Here.
- BlockOffsets. Modernizing Environmental Offset Ownership. Access Here.
- Source: https://investorbites.com/shiba-inu-shib-price-analysis-04-08/
- :is
- :not
- $UP
- 100
- 17
- 20
- 22
- 24
- 28
- 8
- a
- accurately
- Additionally
- advice
- advisor
- aids
- always
- an
- analysis
- and
- ARE
- AS
- At
- Attempts
- BE
- Bear
- bearish
- Bears
- before
- boost
- boosts
- bull
- Bullish
- Bulls
- buy
- buyers
- Buying
- by
- CAN
- capital
- capitalization
- charge
- Chart
- conclusion
- confidence
- considered
- continuing
- control
- crypto
- Current
- Currently
- decisions
- Despite
- Dominate
- down
- drive
- entry
- Exit
- experienced
- financial
- financial advice
- flow
- For
- from
- fueled
- future
- gained
- Gains
- Growth
- High
- higher
- highly
- horizon
- HOURS
- HTTPS
- igniting
- impressive
- in
- Increase
- increasing
- indicates
- Indicator
- Indicators
- information
- insights
- internal
- Inu
- investment
- investor
- Investors
- IT
- ITS
- lasting
- leading
- Leads
- levels
- likelihood
- likely
- Line
- Low
- Making
- Market
- Market Capitalization
- Market News
- market performance
- market sentiment
- market value
- might
- minor
- Momentum
- money
- more
- most
- move
- movement
- Near
- news
- no
- occasional
- of
- on
- ongoing
- Optimism
- Outlook
- over
- overall
- past
- patterns
- performance
- plato
- Plato Data Intelligence
- PlatoData
- points
- positive
- potential
- power
- predicting
- price
- Price Analysis
- price chart
- Prices
- profitable
- Push
- Pushing
- reaching
- remarkable
- research
- respectively
- result
- resulting
- Results
- reviewing
- Rise
- rising
- s
- Selling
- sentiment
- SHIB
- SHIB/USD
- Shiba
- Shiba Inu
- Shiba Inu News
- Shiba Inu Price
- shiba inu price analysis
- should
- show
- showed
- Shows
- significant
- Signs
- Slowing
- Source
- speculative
- strategies
- strong
- substantial
- Suggests
- surge
- than
- that
- The
- their
- There.
- this
- though?
- time
- to
- Tokens
- Traders
- trades
- Trading
- trading volume
- TradingView
- Trend
- TURN
- unpredictable
- Update
- upwards
- use
- Valuable
- value
- volatile
- volume
- What
- What is
- with
- zephyrnet


