SNEAK PEEK
- SOL struggles as bears dominate, but a bullish reversal may be imminent.
- Investors monitor SOL for profit opportunities amidst price declines.
- SOL’s RSI indicates an unfavorable market, presenting a potential buying opportunity.
In the past 24 hours, Solana (SOL) bulls have struggled to gain market control but have been unable to break through the $21.83 resistance level. Due to this hesitation, bears have recently taken control of SOL, causing the price to drop to an intraday low of $20.57.
At press time, SOL’s price had decreased by 4.46% to $20.73 due to the ongoing adverse trend. Since bulls have shown no indications of regaining momentum, bears will likely continue to dominate SOL for the foreseeable future.
Consequently, investors fled the market, causing SOL’s market capitalization and 24-hour trading volume to decrease by 4.32 % and 16.13%, respectively, to $8,351,382,883 and $4,767,623. This decline indicates that bears continue dominating the market, and traders are pessimistic about the bulls’ chances of returning.
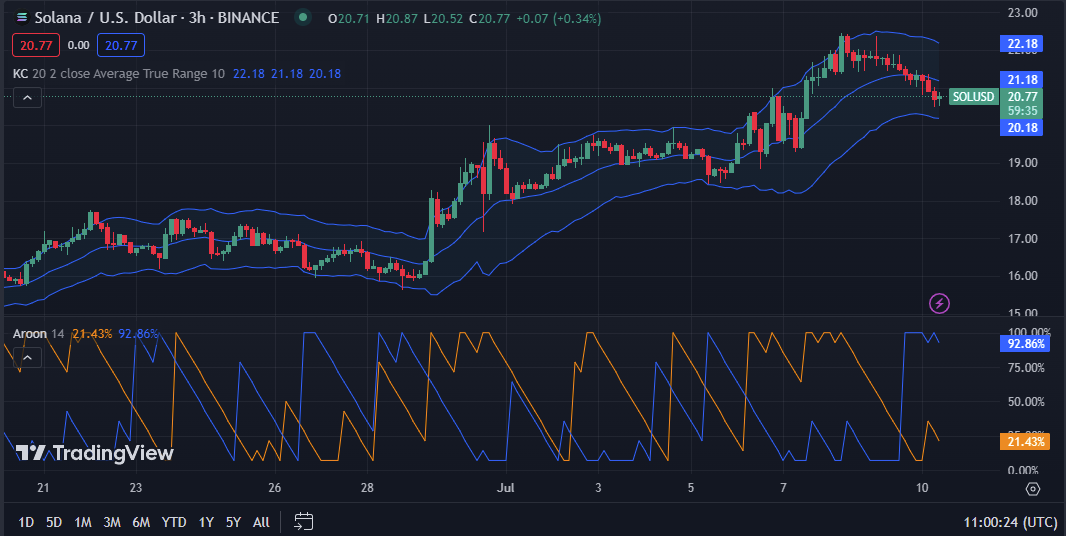
A probable bullish reversal can be anticipated as the Aroon up indicator reads 92.86%, and the Aroon down indicator reads 21.43% on the SOL price chart. This reading could cause the price of SOL to rise if investors become more active and take advantage of the current environment.
Traders should therefore monitor SOL and be prepared to profit from any increases. This action may benefit investors desiring to acquire SOL, enabling them to do so at a discount and profit from a future price increase.
The Keltner Channel bands are moving south, with the upper band at 22.81 and the lower band at 20.18, indicating that the SOL’s bearish momentum is robust and likely to persist for the foreseeable future. This move reflects traders’ expectation that the price of SOL will continue to fall rapidly, but short-term traders may have a fantastic opportunity to profit.

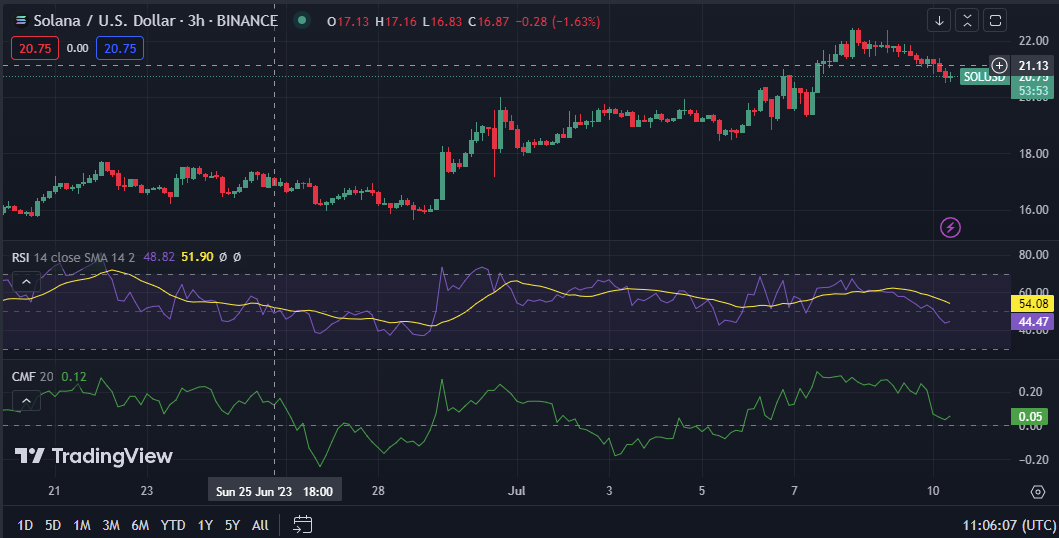
The SOL’s Relative Strength Index (RSI) value of 44.65 and recent decline below its signal line indicate that SOL is currently trading in an unfavorable market, making it a potentially profitable buy for investors seeking to capitalize on current market conditions. This decline suggests that selling pressure exceeds purchasing demand, indicating that the value of SOL will continue to decrease.
Therefore, investors should evaluate whether the potential return of investing in SOL exceeds the risk of future value decline.
A Chaikin Money Flow (CMF) score of 0.05 indicates that SOL is undervalued, which may present an outstanding chance for new investors to enter the market. In addition, an increase in the CMF may mean that SOL is becoming more desirable, and its price may rise accordingly.

In conclusion, as SOL battles bearish dominance, investors remain vigilant for a bullish turnaround. Precise evaluation is vital to seizing profit amid the decline.
Disclaimer: Cryptocurrency price is highly speculative and volatile and should not be considered financial advice. Past and current performance is not indicative of future results. Always research and consult with a financial advisor before making investment decisions.
- SEO Powered Content & PR Distribution. Get Amplified Today.
- PlatoData.Network Vertical Generative Ai. Empower Yourself. Access Here.
- PlatoAiStream. Web3 Intelligence. Knowledge Amplified. Access Here.
- PlatoESG. Automotive / EVs, Carbon, CleanTech, Energy, Environment, Solar, Waste Management. Access Here.
- BlockOffsets. Modernizing Environmental Offset Ownership. Access Here.
- Source: https://investorbites.com/solana-sol-price-analysis-10-07/
- :is
- :not
- $UP
- 12
- 16
- 20
- 22
- 24
- 32
- a
- About
- accordingly
- acquire
- Action
- active
- addition
- ADvantage
- adverse
- advice
- advisor
- always
- Amid
- amidst
- an
- analysis
- and
- Anticipated
- any
- ARE
- AS
- At
- BAND
- battles
- BE
- bearish
- Bearish Momentum
- Bears
- become
- becoming
- been
- before
- below
- benefit
- blockchain
- Break
- Bullish
- Bulls
- but
- buy
- Buying
- by
- CAN
- capitalization
- capitalize
- Cause
- causing
- Chance
- chances
- Channel
- Chart
- conclusion
- conditions
- considered
- continue
- control
- could
- Current
- Currently
- decisions
- Decline
- Declines
- decrease
- Demand
- Discount
- do
- Dominance
- Dominate
- down
- Drop
- due
- enabling
- Enter
- Environment
- evaluate
- evaluation
- EVER
- exceeds
- expectation
- faces
- Fall
- fantastic
- financial
- financial advice
- First
- flow
- For
- For Investors
- foreseeable
- from
- future
- Future Price
- Gain
- had
- Have
- highly
- HOURS
- HTTPS
- if
- imminent
- in
- Increase
- Increases
- index
- indicate
- indicates
- indications
- Indicator
- internal
- investing
- investment
- investor
- Investors
- IT
- ITS
- Level
- likely
- Line
- looms
- Low
- lower
- Making
- Market
- Market Capitalization
- market conditions
- Market News
- May..
- mean
- Momentum
- money
- Monitor
- more
- move
- moving
- New
- news
- no
- of
- on
- ongoing
- opportunities
- Opportunity
- outstanding
- past
- performance
- pessimistic
- plato
- Plato Data Intelligence
- PlatoData
- potential
- potentially
- precise
- prepared
- present
- press
- pressure
- price
- Price Analysis
- price chart
- Price Increase
- Profit
- profitable
- purchasing
- rapidly
- Reading
- recent
- recently
- reflects
- relative
- relative strength index
- remain
- research
- Resistance
- respectively
- Results
- return
- returning
- Reversal
- Rise
- Risk
- robust
- rsi
- score
- seeking
- Selling
- short-term
- should
- shown
- Signal
- since
- So
- SOL
- SOL Price
- SOL/USD
- Solana
- Solana News
- Solana Price
- solana price analysis
- Source
- South
- speculative
- strength
- Struggles
- Suggests
- Take
- taken
- that
- The
- Them
- therefore
- this
- Through
- time
- to
- Traders
- Trading
- trading volume
- TradingView
- Trend
- unable
- value
- vital
- volatile
- volume
- What
- What is
- whether
- which
- will
- with
- zephyrnet


