SNEAK PEEK
- Ripple’s license approval accelerates XRP, unlocking global payment potential.
- The bulls are in control as XRP skyrockets, signaling renewed investor interest.
- XRP’s regulatory approval paves the way for cross-border payment innovation.
By receiving In-Principle Approval of a Major Payments Institution license from the @MAS_sg, Ripple will be able to expand customer use of ODL and offer regulated digital asset products and services. Ripple may now extend its On-Demand Liquidity (ODL) offering, enabling rapid cross-border payments utilizing XRP as an intermediate currency, thanks to the authorization.
We’re honored to obtain In-Principle Approval of a Major Payments Institution License from the @MAS_sg – allowing us to offer regulated digital asset products and services, and scale customer use of #ODL. 🇸🇬
Learn more: https://t.co/8Ylc3lZSeg
— Ripple (@Ripple) June 22, 2023
Due to an increase in positive sentiment, the XRP market has experienced a surge in excitement, causing the price to escalate from its previous value of $0.4916 to a peak of $0.5232 within the past 24 hours. The price is presently at $0.51, reflecting the continued increasing trend
Throughout this bullish rise, XRP’s market capitalization increased by 2.55% to $26,568,622,780, while its trading volume increased by 24.68% to $1,501,416,000 in the last 24 hours.
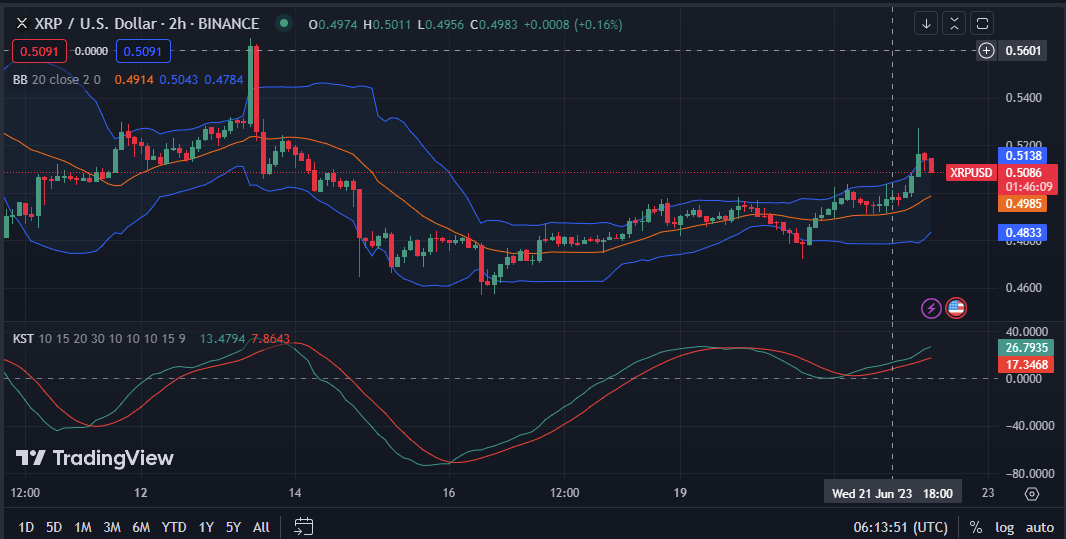
The Bollinger bands, which have upper readings of 0.5138 and lower readings of 0.4833, are bulging, indicating a significant degree of market volatility. Soon, traders should expect a substantial price fluctuation. The distance between the upper and lower bands of the XRP market is 0.0305, indicating a moderate level of market volatility.
With a reading of 27.5020 and a movement above its signal line, the Know Sure Thing (KST) signals that bullish momentum is increasing in the market. Investors may consider selling existing long holdings or opening new ones if the KST line crosses below the signal line, which may be a sell signal.
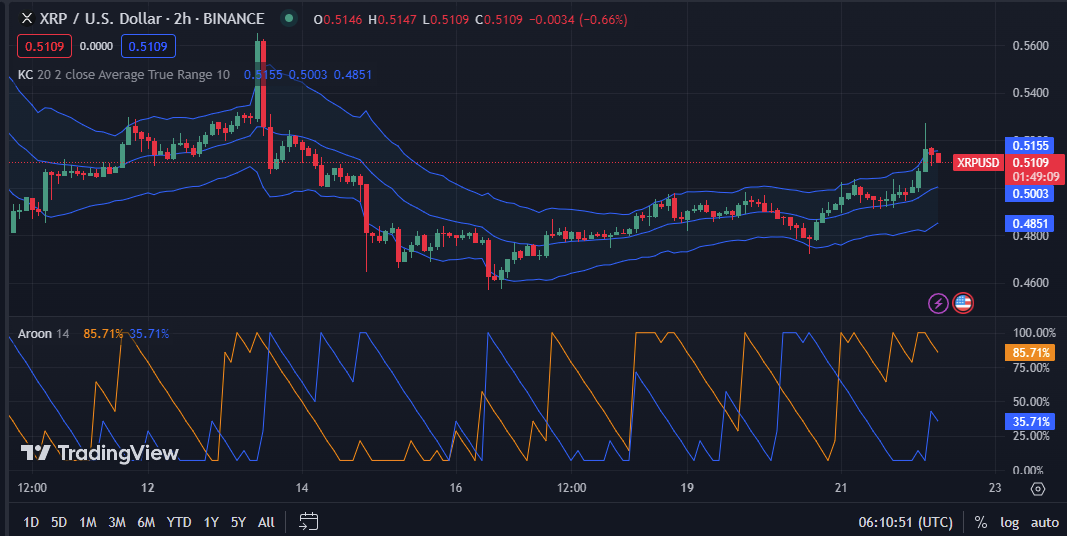
The figures for the Aroon up and down are 85.71% and 35.71%, respectively, on the XRP 2-hour price chart. This move demonstrates that the trend is strong and is likely to continue for some time, despite the possibility of brief reversals along the road, allowing traders to pinpoint potential entry and exit opportunities for trades.
On the 2-hour price chart for XRP, the Keltner Channel bands are pointing north and have upper and lower values of 0.5151 and 0.4861, respectively, denoting a bullish trend. Traders may want to purchase XRP now with a sell target price close to the upper Keltner Channel.
The bullish momentum is supported as green candlesticks develop on the XRP price chart, and the price movement moves higher than the middle band. However, traders should be cautious of potential resistance levels and implement a stop loss to minimize risk if the bulls’ strength fades.
In conclusion, XRP rides the waves of regulatory approval and bullish momentum, setting sail for new horizons in cross-border payments and digital asset services.
Disclaimer: Cryptocurrency price is highly speculative and volatile and should not be considered financial advice. Past and current performance is not indicative of future results. Always research and consult with a financial advisor before making investment decisions.
- SEO Powered Content & PR Distribution. Get Amplified Today.
- EVM Finance. Unified Interface for Decentralized Finance. Access Here.
- Quantum Media Group. IR/PR Amplified. Access Here.
- PlatoAiStream. Web3 Data Intelligence. Knowledge Amplified. Access Here.
- Source: https://investorbites.com/xrp-price-analysis-22-06/
- :has
- :is
- :not
- $UP
- 000
- 10
- 22
- 24
- 27
- 51
- a
- Able
- above
- accelerates
- advice
- advisor
- Allowing
- along
- always
- an
- analysis
- and
- approval
- ARE
- AS
- asset
- At
- authorization
- BAND
- BE
- before
- below
- between
- Bollinger bands
- Bullish
- Bulls
- by
- candlesticks
- causing
- cautious
- Center
- Channel
- Chart
- Close
- conclusion
- Consider
- considered
- continue
- continued
- control
- cross-border
- cross-border payments
- Currency
- Current
- customer
- decisions
- Degree
- demonstrates
- Despite
- develop
- digital
- Digital Asset
- distance
- down
- enabling
- entry
- Excitement
- existing
- Exit
- Expand
- expect
- experienced
- extend
- external
- Fades
- Figures
- financial
- financial advice
- fluctuation
- For
- from
- future
- Global
- Green
- Have
- higher
- highly
- Holdings
- honored
- Horizons
- HOURS
- However
- HTTPS
- if
- implement
- in
- Increase
- increased
- increasing
- Innovation
- Institution
- interest
- internal
- investment
- investor
- Investors
- ITS
- Know
- Last
- Level
- levels
- License
- likely
- Line
- Liquidity
- Long
- loss
- lower
- major
- Making
- Market
- Market News
- market volatility
- May..
- Middle
- Momentum
- more
- move
- movement
- moves
- New
- new horizons
- news
- North
- now
- obtain
- ODL
- of
- offer
- offering
- on
- On-Demand
- On-Demand Liquidity
- ones
- opening
- opportunities
- or
- past
- payment
- payments
- Peak
- performance
- plato
- Plato Data Intelligence
- PlatoData
- positive
- possibility
- potential
- previous
- price
- Price Analysis
- price chart
- Products
- purchase
- rapid
- Reading
- receiving
- regulated
- regulatory
- regulatory approval
- renewed
- research
- Resistance
- respectively
- Results
- Revolution
- Ripple
- Ripple News
- Rise
- Risk
- road
- s
- Scale
- sell
- Selling
- sentiment
- Services
- setting
- should
- Signal
- signals
- significant
- Skyrockets
- some
- soon
- Source
- speculative
- Stop
- strength
- strong
- substantial
- Supported
- surge
- Target
- than
- Thanks
- that
- The
- thing
- this
- time
- to
- Traders
- trades
- Trading
- trading volume
- TradingView
- Trend
- unleashes
- unlocking
- us
- use
- Utilizing
- value
- Values
- volatile
- Volatility
- volume
- want
- waves
- Way..
- which
- while
- will
- with
- within
- xrp
- XRP Price
- XRP price analysis
- XRP/USD
- zephyrnet


