SNEAK PEEK
- The SUI market faces bearish dominance, and prices drop.
- Profit-taking and market sentiment drive SUI’s prices down.
- High trading volume indicates continued interest in SUI despite the drop.
Over the past 24 hours, the Sui market (SUI) has worsened, with prices dropping from an intraday high of $1.14 to an intraday low of $1.04 due to the bearish dominance. This price decline is attributed to profit-taking by buyers who had purchased at lower prices and the general bearish market sentiment.
SUI’s price had decreased by 7.43% from the previous close to $1.05 at the time of writing. This movement suggests a significant price decline and correction.
SUI’s market capitalization decreased by 7.43% during the recession to $557,128,670, while its 24-hour trading volume increased by 107.61% to $179,625,876. This action shows that despite the recent price drop, there is still high interest in and demand for SUI among traders and investors.
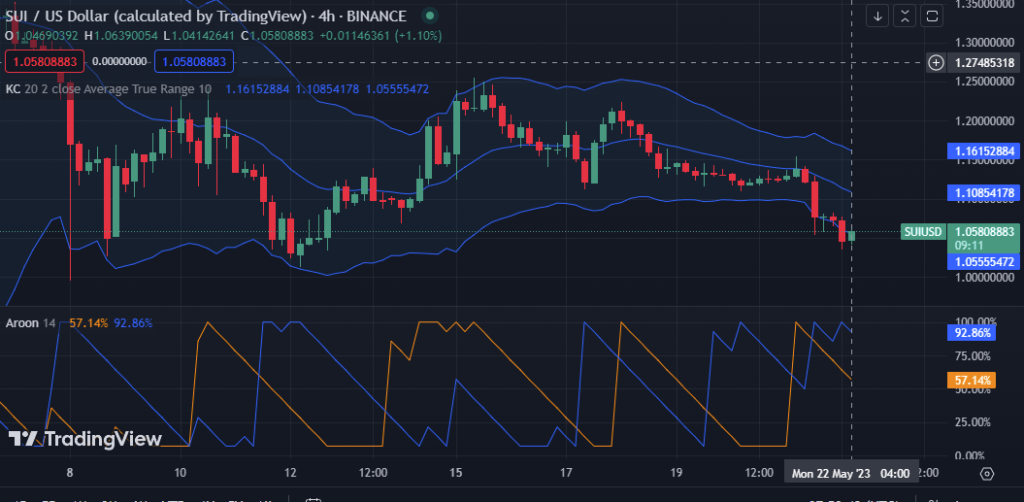
The upper and lower Kelter Channel readings on SUI’s price chart are 1.16130184 and 1.05532772, respectively, moving southward. According to this movement, the price is likely to remain within a relatively small range, with neither significant upward nor downward trends foreseen anytime soon.
However, red candlestick movement on the lower band points to a persistent bearish trend in the market, warning traders to liquidate their positions or wait for a better entry point.
The Aroon up and down have 57.14% and 92.86%, respectively, indicating that the market is experiencing bearish momentum. Sellers have taken control of the market and are pushing prices lower. Trading participants may interpret this as a sign to short or exit their positions, given the likelihood of further price declines.

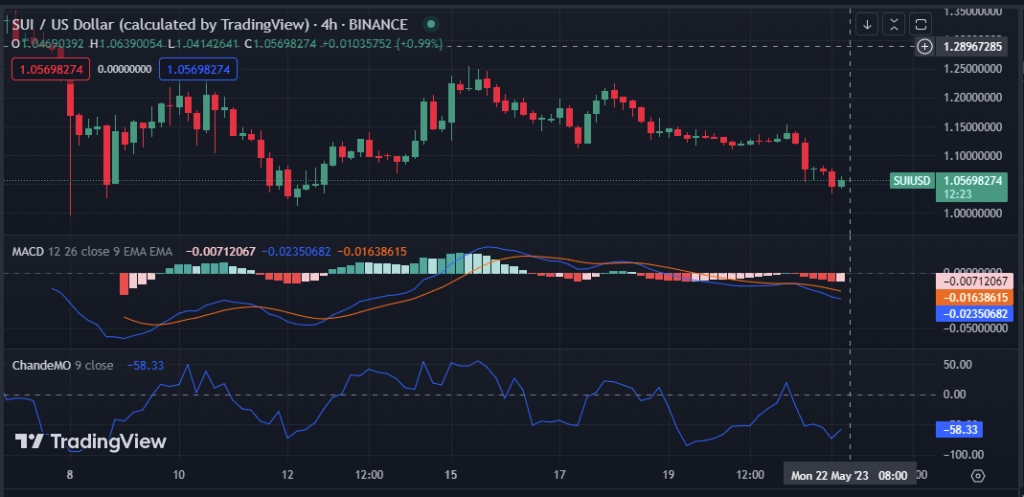
The MACD blue line, which has a value of -0.02360873, moves into negative territory and drops below the signal line on the SUI market’s 4-hour price chart, indicating that the market is becoming more bearish. As sellers may seize market control, this move may portend a short-term downward trend for SUI.
On the 4-hour price chart of the SUI market, the Chande Momentum Oscillator (ChandeMO) crosses into negative territory with a reading of -58.33%. This move points to a bearish market trend and the possibility of further price drops. To limit potential losses, traders may consider taking short positions or selling long ones.

In conclusion, as the SUI market faces bearish dominance and prices continue to drop, traders must closely monitor the situation and consider their positions wisely to navigate potential further declines.
Disclaimer: Cryptocurrency price is highly speculative and volatile and should not be considered financial advice. Past and current performance is not indicative of future results. Always research and consult with a financial advisor before making investment decisions
- SEO Powered Content & PR Distribution. Get Amplified Today.
- PlatoAiStream. Web3 Data Intelligence. Knowledge Amplified. Access Here.
- Minting the Future w Adryenn Ashley. Access Here.
- Buy and Sell Shares in PRE-IPO Companies with PREIPO®. Access Here.
- Source: https://investorbites.com/sui-price-analysis-5-22/
- :has
- :is
- :not
- $UP
- 1
- 14
- 22
- 24
- 7
- a
- According
- Action
- advice
- advisor
- always
- among
- an
- analysis
- and
- ARE
- AS
- At
- BAND
- BE
- bearish
- bearish market
- Bearish Momentum
- becoming
- before
- below
- Better
- Blue
- buyers
- by
- capitalization
- Channel
- Chart
- Close
- closely
- conclusion
- Consider
- considered
- continue
- continued
- control
- Current
- Decline
- Declines
- Demand
- Despite
- Dip
- Dominance
- down
- downward
- drive
- Drop
- Dropping
- Drops
- due
- during
- entry
- Exit
- experiencing
- faces
- financial
- financial advice
- For
- from
- further
- future
- General
- given
- had
- Have
- High
- highly
- HOURS
- HTTPS
- in
- increased
- indicates
- interest
- internal
- into
- investment
- investor
- Investors
- ITS
- likely
- LIMIT
- Line
- liquidate
- Long
- losses
- Low
- lower
- MACD
- Making
- Market
- Market Capitalization
- Market News
- market sentiment
- max-width
- May..
- Momentum
- Monitor
- more
- move
- movement
- moves
- moving
- must
- Navigate
- negative
- negative territory
- Neither
- news
- of
- on
- ones
- or
- participants
- past
- performance
- plato
- Plato Data Intelligence
- PlatoData
- Point
- points
- positions
- possibility
- potential
- previous
- price
- Price Analysis
- price chart
- Prices
- purchased
- Pushing
- range
- Reading
- recent
- recession
- Red
- relatively
- remain
- research
- resilient
- respectively
- Results
- Reversal
- Seize
- Sellers
- Selling
- sentiment
- Short
- short-term
- should
- Shows
- sign
- Signal
- significant
- situation
- small
- Source
- speculative
- Still
- Suggests
- Sui
- taken
- taking
- territory
- that
- The
- their
- There.
- this
- time
- to
- Traders
- Trading
- trading volume
- TradingView
- Trend
- Trends
- upward
- value
- volatile
- volume
- wait
- warning
- which
- while
- WHO
- with
- within
- writing
- zephyrnet


